| Open: | 3,046.46 |
| Change: | -23.40 |
| Volume: | 533,864 |
| Low: | 2,999.53 |
| High: | 3,047.56 |
| High / Low range: | 48.03 |
| Type: | Commodities |
| Ticker: | XAUUSD |
| ISIN: |
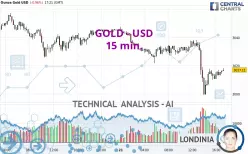
GOLD - USD - 15 min. - Technical analysis published on 03/21/2025 (GMT)
- 130
- 0
- 03/21/2025 - 17:21
- Timeframe : 15 min.
- - Analysis generated on 03/21/2025 - 17:21
- Status : IN PROGRESS...

Summary of the analysis

Additional analysis
Quotes
The GOLD - USD price is 3,017.08 USD. On the day, this instrument lost -0.96% and was between 2,999.53 USD and 3,047.56 USD. This implies that the price is at +0.59% from its lowest and at -1.00% from its highest.A bullish opening was detected by the Central Gaps scanner. Buyers are trying to impose a bullish momentum in the very short term.
Bullish opening
Type : Bullish
Timeframe : Openning
A study of price movements over other periods shows the following variations:
New HIGH record (5 years)
Type : Bullish
Timeframe : Weekly
Near a new HIGH record (1 year)
Type : Bullish
Timeframe : Weekly
Near a new HIGH record (1st january)
Type : Bullish
Timeframe : Weekly
Near a new HIGH record (1 month)
Type : Bullish
Timeframe : Weekly
Technical
Technical analysis of GOLD - USD in 15 min. shows a overall strongly bearish trend. 82.14% of the signals given by moving averages are bearish. Caution: as the signals currently given by short-term moving averages are rather neutral, the global trend is slowing down. The Central Indicators scanner detects bullish signals on moving averages that could impact this trend:
Bullish price crossover with Moving Average 20
Type : Bullish
Timeframe : 15 minutes
Bullish price crossover with adaptative moving average 20
Type : Bullish
Timeframe : 15 minutes
The probability of a further increase are moderate given the direction of the technical indicators.
Caution: the Central Indicators scanner currently detects an excess:
Williams %R indicator is overbought : over -20
Type : Neutral
Timeframe : 15 minutes
Pivot points : price is under support 1 (Daily)
Type : Neutral
Timeframe : 15 minutes
Aroon indicator bullish trend
Type : Bullish
Timeframe : 15 minutes
Central Patterns, the scanner specializing in chart patterns, did not identify any signals.
From the Japanese candlestick perspective, the Central Candlesticks scanner notes the presence of these results that could impact the short-term trend:
Bearish harami cross
Type : Bearish
Timeframe : 15 minutes
Three white soldiers
Type : Bullish
Timeframe : 15 minutes
| S3 | S2 | S1 | Price | R1 | R2 | |
|---|---|---|---|---|---|---|
| ProTrendLines | 2,932.50 | 2,950.03 | 2,981.60 | 3,017.08 | 3,026.07 | 3,057.48 |
| Change (%) | -2.80% | -2.22% | -1.18% | - | +0.30% | +1.34% |
| Change | -84.58 | -67.05 | -35.48 | - | +8.99 | +40.40 |
| Level | Minor | Intermediate | Minor | - | Major | Intermediate |
Attention could also be paid to pivot points to set price objectives:
| Pivot points | S3 | S2 | S1 | PP | R1 | R2 | R3 |
|---|---|---|---|---|---|---|---|
| Standard | 2,997.21 | 3,011.47 | 3,028.96 | 3,043.22 | 3,060.71 | 3,074.97 | 3,092.46 |
| Camarilla | 3,037.72 | 3,040.63 | 3,043.54 | 3,046.45 | 3,049.36 | 3,052.27 | 3,055.18 |
| Woodie | 2,998.83 | 3,012.28 | 3,030.58 | 3,044.03 | 3,062.33 | 3,075.78 | 3,094.08 |
| Fibonacci | 3,011.47 | 3,023.60 | 3,031.09 | 3,043.22 | 3,055.35 | 3,062.84 | 3,074.97 |
| Pivot points | S3 | S2 | S1 | PP | R1 | R2 | R3 |
|---|---|---|---|---|---|---|---|
| Standard | 2,780.70 | 2,830.49 | 2,905.37 | 2,955.16 | 3,030.04 | 3,079.83 | 3,154.71 |
| Camarilla | 2,945.97 | 2,957.39 | 2,968.82 | 2,980.25 | 2,991.68 | 3,003.11 | 3,014.53 |
| Woodie | 2,793.25 | 2,836.76 | 2,917.92 | 2,961.43 | 3,042.59 | 3,086.10 | 3,167.26 |
| Fibonacci | 2,830.49 | 2,878.11 | 2,907.54 | 2,955.16 | 3,002.78 | 3,032.21 | 3,079.83 |
| Pivot points | S3 | S2 | S1 | PP | R1 | R2 | R3 |
|---|---|---|---|---|---|---|---|
| Standard | 2,583.31 | 2,677.77 | 2,767.31 | 2,861.77 | 2,951.31 | 3,045.77 | 3,135.31 |
| Camarilla | 2,806.24 | 2,823.11 | 2,839.97 | 2,856.84 | 2,873.71 | 2,890.57 | 2,907.44 |
| Woodie | 2,580.84 | 2,676.54 | 2,764.84 | 2,860.54 | 2,948.84 | 3,044.54 | 3,132.84 |
| Fibonacci | 2,677.77 | 2,748.06 | 2,791.49 | 2,861.77 | 2,932.06 | 2,975.49 | 3,045.77 |
Numerical data
The following is the status of the technical indicators and moving averages at the time of publication of this technical analysis:
| RSI (14): | 47.35 | |
| MACD (12,26,9): | -3.4000 | |
| Directional Movement: | -6.38 | |
| AROON (14): | 92.86 | |
| DEMA (21): | 3,012.84 | |
| Parabolic SAR (0,02-0,02-0,2): | 3,000.93 | |
| Elder Ray (13): | 1.35 | |
| Super Trend (3,10): | 3,021.16 | |
| Zig ZAG (10): | 3,018.00 | |
| VORTEX (21): | 0.8500 | |
| Stochastique (14,3,5): | 81.30 | |
| TEMA (21): | 3,012.41 | |
| Williams %R (14): | -4.23 | |
| Chande Momentum Oscillator (20): | 8.84 | |
| Repulse (5,40,3): | 0.0500 | |
| ROCnROLL: | -1 | |
| TRIX (15,9): | -0.0200 | |
| Courbe Coppock: | 0.36 |
| MA7: | 3,015.97 | |
| MA20: | 2,945.88 | |
| MA50: | 2,867.93 | |
| MA100: | 2,758.29 | |
| MAexp7: | 3,015.35 | |
| MAexp20: | 3,017.76 | |
| MAexp50: | 3,024.06 | |
| MAexp100: | 3,029.50 | |
| Price / MA7: | +0.04% | |
| Price / MA20: | +2.42% | |
| Price / MA50: | +5.20% | |
| Price / MA100: | +9.38% | |
| Price / MAexp7: | +0.06% | |
| Price / MAexp20: | -0.02% | |
| Price / MAexp50: | -0.23% | |
| Price / MAexp100: | -0.41% |
News
The latest news and videos published on GOLD - USD at the time of the analysis were as follows:
-
03/21/2025 - 15:03
 XAU/USD Weekly Forecast, Technical Analysis (Mar 24 - 28): Gold Has Another Bullish Week
-
03/21/2025 - 14:46
XAU/USD Price Forecast Today, Technical Analysis (March 21): Gold Pulls Back Slightly
-
03/20/2025 - 20:46
XAU/USD Price Forecast Today, Technical Analysis (March 20): Gold Hits Record but Momentum Stalls
-
03/20/2025 - 13:48
XAU/USD Price Forecast Today, Technical Analysis (March 20): Gold Continues to Bounce Around
-
03/19/2025 - 20:42
XAU/USD Price Forecast Today, Technical Analysis (March 19): Gold Hits Yet Another All-Time High
About author

Online


Add a comment
Comments
0 comments on the analysis GOLD - USD - 15 min.