GOLD - USD - Daily - Technical analysis published on 03/21/2025 (GMT)
- 113
- 0
- Timeframe : Daily
- - Analysis generated on
- Status : IN PROGRESS...

Summary of the analysis

Additional analysis
Quotes
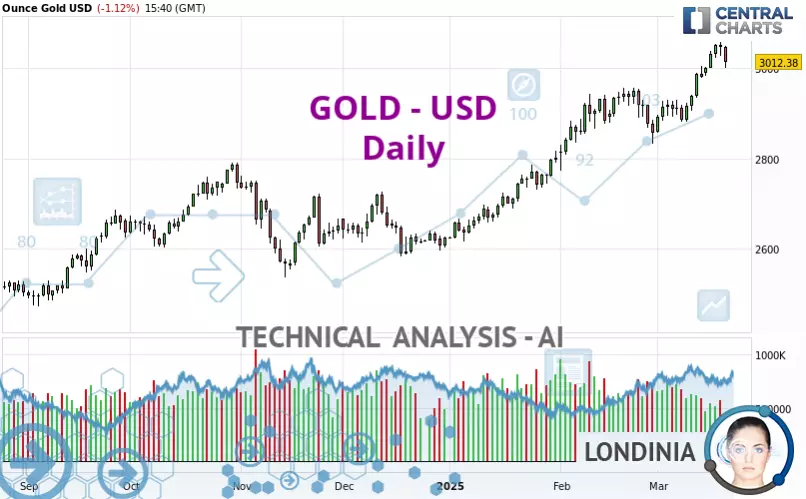
GOLD - USD rating 3,012.67 USD. On the day, this instrument lost -1.11% and was traded between 2,999.53 USD and 3,047.56 USD over the period. The price is currently at +0.44% from its lowest and -1.14% from its highest.A bullish opening was detected by the Central Gaps scanner. Buyers are trying to impose a bullish momentum in the very short term.
Bullish opening
Type : Bullish
Timeframe : Openning
A study of price movements over other periods shows the following variations:
New HIGH record (5 years)
Type : Bullish
Timeframe : Weekly
Near a new HIGH record (1 year)
Type : Bullish
Timeframe : Weekly
Near a new HIGH record (1st january)
Type : Bullish
Timeframe : Weekly
Near a new HIGH record (1 month)
Type : Bullish
Timeframe : Weekly
Technical
A technical analysis in Daily of this GOLD - USD chart shows a strongly bullish trend. 92.86% of the signals given by moving averages are bullish. The overall trend is supported by the strong bullish signals from short-term moving averages. The Central Indicators scanner does not detect any result on moving averages that would impact this trend.
The probability of a further increase is high given the direction of the technical indicators.
But beware of excesses. The Central Indicators scanner currently detects this:
CCI indicator is overbought : over 100
Type : Neutral
Timeframe : Daily
Pivot points : price is under support 1 (Daily)
Type : Neutral
Timeframe : Daily
The analysis of the price chart with Central Patterns scanners does not return any result.
The Central Candlesticks scanner, specialised in Japanese candlesticks, did not identify any signals.
| S3 | S2 | S1 | Price | |
|---|---|---|---|---|
| ProTrendLines | 2,718.86 | 2,785.43 | 2,950.03 | 3,012.67 |
| Change (%) | -9.75% | -7.54% | -2.08% | - |
| Change | -293.81 | -227.24 | -62.64 | - |
| Level | Major | Minor | Intermediate | - |
Pivot points can also be used to set your price objectives. Here is the price situation in relation to pivot points:
| Pivot points | S3 | S2 | S1 | PP | R1 | R2 | R3 |
|---|---|---|---|---|---|---|---|
| Standard | 2,997.21 | 3,011.47 | 3,028.96 | 3,043.22 | 3,060.71 | 3,074.97 | 3,092.46 |
| Camarilla | 3,037.72 | 3,040.63 | 3,043.54 | 3,046.45 | 3,049.36 | 3,052.27 | 3,055.18 |
| Woodie | 2,998.83 | 3,012.28 | 3,030.58 | 3,044.03 | 3,062.33 | 3,075.78 | 3,094.08 |
| Fibonacci | 3,011.47 | 3,023.60 | 3,031.09 | 3,043.22 | 3,055.35 | 3,062.84 | 3,074.97 |
| Pivot points | S3 | S2 | S1 | PP | R1 | R2 | R3 |
|---|---|---|---|---|---|---|---|
| Standard | 2,780.70 | 2,830.49 | 2,905.37 | 2,955.16 | 3,030.04 | 3,079.83 | 3,154.71 |
| Camarilla | 2,945.97 | 2,957.39 | 2,968.82 | 2,980.25 | 2,991.68 | 3,003.11 | 3,014.53 |
| Woodie | 2,793.25 | 2,836.76 | 2,917.92 | 2,961.43 | 3,042.59 | 3,086.10 | 3,167.26 |
| Fibonacci | 2,830.49 | 2,878.11 | 2,907.54 | 2,955.16 | 3,002.78 | 3,032.21 | 3,079.83 |
| Pivot points | S3 | S2 | S1 | PP | R1 | R2 | R3 |
|---|---|---|---|---|---|---|---|
| Standard | 2,583.31 | 2,677.77 | 2,767.31 | 2,861.77 | 2,951.31 | 3,045.77 | 3,135.31 |
| Camarilla | 2,806.24 | 2,823.11 | 2,839.97 | 2,856.84 | 2,873.71 | 2,890.57 | 2,907.44 |
| Woodie | 2,580.84 | 2,676.54 | 2,764.84 | 2,860.54 | 2,948.84 | 3,044.54 | 3,132.84 |
| Fibonacci | 2,677.77 | 2,748.06 | 2,791.49 | 2,861.77 | 2,932.06 | 2,975.49 | 3,045.77 |
Numerical data
The following is the status of the technical indicators and moving averages at the time of publication of this technical analysis:
| RSI (14): | 63.43 | |
| MACD (12,26,9): | 45.2100 | |
| Directional Movement: | 14.96 | |
| AROON (14): | 92.86 | |
| DEMA (21): | 3,017.14 | |
| Parabolic SAR (0,02-0,02-0,2): | 2,931.14 | |
| Elder Ray (13): | 40.94 | |
| Super Trend (3,10): | 2,930.98 | |
| Zig ZAG (10): | 3,013.95 | |
| VORTEX (21): | 1.0900 | |
| Stochastique (14,3,5): | 89.73 | |
| TEMA (21): | 3,025.38 | |
| Williams %R (14): | -23.97 | |
| Chande Momentum Oscillator (20): | 97.10 | |
| Repulse (5,40,3): | 0.1400 | |
| ROCnROLL: | 1 | |
| TRIX (15,9): | 0.1900 | |
| Courbe Coppock: | 7.38 |
| MA7: | 3,015.83 | |
| MA20: | 2,945.36 | |
| MA50: | 2,867.71 | |
| MA100: | 2,758.20 | |
| MAexp7: | 3,010.05 | |
| MAexp20: | 2,958.61 | |
| MAexp50: | 2,878.84 | |
| MAexp100: | 2,788.08 | |
| Price / MA7: | -0.10% | |
| Price / MA20: | +2.29% | |
| Price / MA50: | +5.05% | |
| Price / MA100: | +9.23% | |
| Price / MAexp7: | +0.08% | |
| Price / MAexp20: | +1.82% | |
| Price / MAexp50: | +4.64% | |
| Price / MAexp100: | +8.04% |
News
The latest news and videos published on GOLD - USD at the time of the analysis were as follows:
-
 XAU/USD Price Forecast Today, Technical Analysis (March 21): Gold Pulls Back Slightly
-
XAU/USD Price Forecast Today, Technical Analysis (March 20): Gold Hits Record but Momentum Stalls
-
XAU/USD Price Forecast Today, Technical Analysis (March 20): Gold Continues to Bounce Around
-
XAU/USD Price Forecast Today, Technical Analysis (March 19): Gold Hits Yet Another All-Time High
-
XAU/USD Price Forecast Today, Technical Analysis (March 19): Gold Rallies Again on Wednesday
About author

Online


Add a comment
Comments
0 comments on the analysis GOLD - USD - Daily