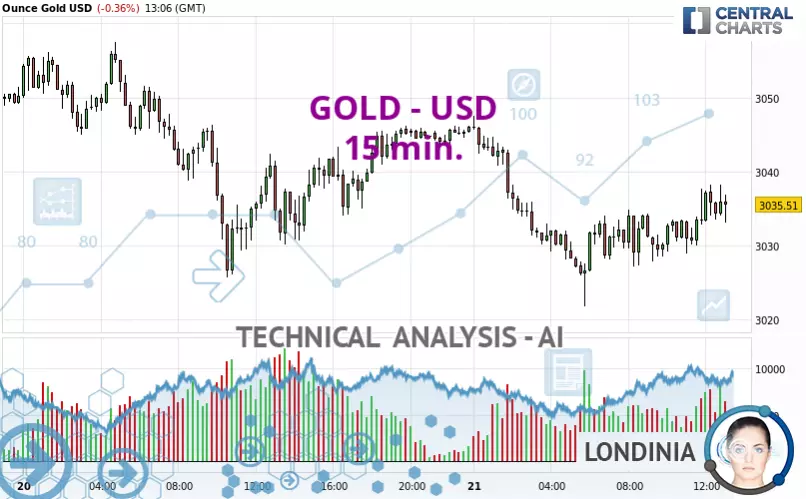
GOLD - USD - 15 min. - Technical analysis published on 03/21/2025 (GMT)
- 118
- 0
Click here for a new analysis!
- Timeframe : 15 min.
- - Analysis generated on
- Status : INVALID

Summary of the analysis

Additional analysis
Quotes
The GOLD - USD price is 3,035.55 USD. The price is lower by -0.36% since the last closing and was between 3,021.77 USD and 3,047.56 USD. This implies that the price is at +0.46% from its lowest and at -0.39% from its highest.The Central Gaps scanner detects a bullish opening. A small advantage for buyers in the very short term.
Bullish opening
Type : Bullish
Timeframe : Openning
A study of price movements over other periods shows the following variations:
New HIGH record (5 years)
Type : Bullish
Timeframe : Weekly
Near a new HIGH record (1 year)
Type : Bullish
Timeframe : Weekly
Near a new HIGH record (1st january)
Type : Bullish
Timeframe : Weekly
Near a new HIGH record (1 month)
Type : Bullish
Timeframe : Weekly
Technical
A technical analysis in 15 min. of this GOLD - USD chart shows a neutral trend. This indecision could turn into a bullish trend due to the strong bullish signals currently being given by short-term moving averages. The Central Indicators scanner does not detect any result on moving averages that would impact this trend.
In fact, 12 technical indicators on 18 studied are currently bullish. Caution: the Central Indicators scanner currently detects an excess:
CCI indicator is overbought : over 100
Type : Neutral
Timeframe : 15 minutes
Williams %R indicator is overbought : over -20
Type : Neutral
Timeframe : 15 minutes
Pivot points : price is over resistance 1 (Daily)
Type : Neutral
Timeframe : Weekly
Pivot points : price is over resistance 1 (Weekly)
Type : Neutral
Timeframe : 15 minutes
Pivot points : price is over resistance 1 (Monthly)
Type : Neutral
Timeframe : 15 minutes
No signals are given by Central Patterns, a market scanner specialised in chart patterns, resistances and supports.
No result was found by the Central Candlesticks scanner on Japanese candlesticks.
| S3 | S2 | S1 | Price | R1 | |
|---|---|---|---|---|---|
| ProTrendLines | 2,950.03 | 2,981.60 | 3,026.07 | 3,035.55 | 3,057.48 |
| Change (%) | -2.82% | -1.78% | -0.31% | - | +0.72% |
| Change | -85.52 | -53.95 | -9.48 | - | +21.93 |
| Level | Intermediate | Minor | Major | - | Intermediate |
Pivot points can also be used to set your price objectives. Here is the price situation in relation to pivot points:
| Pivot points | S3 | S2 | S1 | PP | R1 | R2 | R3 |
|---|---|---|---|---|---|---|---|
| Standard | 2,997.21 | 3,011.47 | 3,028.96 | 3,043.22 | 3,060.71 | 3,074.97 | 3,092.46 |
| Camarilla | 3,037.72 | 3,040.63 | 3,043.54 | 3,046.45 | 3,049.36 | 3,052.27 | 3,055.18 |
| Woodie | 2,998.83 | 3,012.28 | 3,030.58 | 3,044.03 | 3,062.33 | 3,075.78 | 3,094.08 |
| Fibonacci | 3,011.47 | 3,023.60 | 3,031.09 | 3,043.22 | 3,055.35 | 3,062.84 | 3,074.97 |
| Pivot points | S3 | S2 | S1 | PP | R1 | R2 | R3 |
|---|---|---|---|---|---|---|---|
| Standard | 2,780.70 | 2,830.49 | 2,905.37 | 2,955.16 | 3,030.04 | 3,079.83 | 3,154.71 |
| Camarilla | 2,945.97 | 2,957.39 | 2,968.82 | 2,980.25 | 2,991.68 | 3,003.11 | 3,014.53 |
| Woodie | 2,793.25 | 2,836.76 | 2,917.92 | 2,961.43 | 3,042.59 | 3,086.10 | 3,167.26 |
| Fibonacci | 2,830.49 | 2,878.11 | 2,907.54 | 2,955.16 | 3,002.78 | 3,032.21 | 3,079.83 |
| Pivot points | S3 | S2 | S1 | PP | R1 | R2 | R3 |
|---|---|---|---|---|---|---|---|
| Standard | 2,583.31 | 2,677.77 | 2,767.31 | 2,861.77 | 2,951.31 | 3,045.77 | 3,135.31 |
| Camarilla | 2,806.24 | 2,823.11 | 2,839.97 | 2,856.84 | 2,873.71 | 2,890.57 | 2,907.44 |
| Woodie | 2,580.84 | 2,676.54 | 2,764.84 | 2,860.54 | 2,948.84 | 3,044.54 | 3,132.84 |
| Fibonacci | 2,677.77 | 2,748.06 | 2,791.49 | 2,861.77 | 2,932.06 | 2,975.49 | 3,045.77 |
Numerical data
The following is the status of the technical indicators and moving averages at the time of publication of this technical analysis:
| RSI (14): | 56.49 | |
| MACD (12,26,9): | 0.6600 | |
| Directional Movement: | 5.18 | |
| AROON (14): | 64.28 | |
| DEMA (21): | 3,033.94 | |
| Parabolic SAR (0,02-0,02-0,2): | 3,030.91 | |
| Elder Ray (13): | 1.80 | |
| Super Trend (3,10): | 3,026.40 | |
| Zig ZAG (10): | 3,038.08 | |
| VORTEX (21): | 1.0600 | |
| Stochastique (14,3,5): | 72.69 | |
| TEMA (21): | 3,035.64 | |
| Williams %R (14): | -20.23 | |
| Chande Momentum Oscillator (20): | 5.63 | |
| Repulse (5,40,3): | 0.0100 | |
| ROCnROLL: | 1 | |
| TRIX (15,9): | 0.0000 | |
| Courbe Coppock: | 0.22 |
| MA7: | 3,018.58 | |
| MA20: | 2,946.70 | |
| MA50: | 2,868.26 | |
| MA100: | 2,758.47 | |
| MAexp7: | 3,034.52 | |
| MAexp20: | 3,033.00 | |
| MAexp50: | 3,033.85 | |
| MAexp100: | 3,035.99 | |
| Price / MA7: | +0.56% | |
| Price / MA20: | +3.02% | |
| Price / MA50: | +5.83% | |
| Price / MA100: | +10.04% | |
| Price / MAexp7: | +0.04% | |
| Price / MAexp20: | +0.09% | |
| Price / MAexp50: | +0.06% | |
| Price / MAexp100: | -0.01% |
News
The last news published on GOLD - USD at the time of the generation of this analysis was as follows:
-
 XAU/USD Price Forecast Today, Technical Analysis (March 20): Gold Hits Record but Momentum Stalls
-
XAU/USD Price Forecast Today, Technical Analysis (March 20): Gold Continues to Bounce Around
-
XAU/USD Price Forecast Today, Technical Analysis (March 19): Gold Hits Yet Another All-Time High
-
XAU/USD Price Forecast Today, Technical Analysis (March 19): Gold Rallies Again on Wednesday
-
#YourQuestionsAnswered | Why is gold shooting up now that Trump is back?
About author

Online


Add a comment
Comments
0 comments on the analysis GOLD - USD - 15 min.