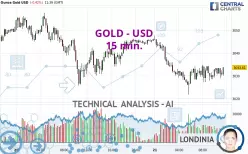
GOLD - USD - 15 min. - Technical analysis published on 03/21/2025 (GMT)
- 124
- 0
Click here for a new analysis!
- Timeframe : 15 min.
- - Analysis generated on
- Status : TARGET REACHED

Summary of the analysis

Additional analysis
Quotes
The GOLD - USD rating is 3,033.64 USD. On the day, this instrument lost -0.42% and was traded between 3,021.77 USD and 3,047.56 USD over the period. The price is currently at +0.39% from its lowest and -0.46% from its highest.The Central Gaps scanner detects a bullish opening marking the presence of buyers ahead of sellers at the opening but not sufficiently marked to allow the price to register a quotation gap.
Bullish opening
Type : Bullish
Timeframe : Openning
So that you have an overall view of the price change, here is a table showing the variations over several periods:
New HIGH record (5 years)
Type : Bullish
Timeframe : Weekly
Near a new HIGH record (1 year)
Type : Bullish
Timeframe : Weekly
Near a new HIGH record (1st january)
Type : Bullish
Timeframe : Weekly
Near a new HIGH record (1 month)
Type : Bullish
Timeframe : Weekly
Technical
Technical analysis of GOLD - USD in 15 min. shows an overall bearish trend. The signals given by moving averages are 75.00% bearish. This bearish trend could slow down given the neutral signals currently being given by short-term moving averages. The Central Indicators market scanner is currently detecting a bearish signal that could impact this trend:
Bearish price crossover with Moving Average 20
Type : Bearish
Timeframe : 15 minutes
The probability of a further increase is slight given the direction of the technical indicators.
Central Indicators, the scanner specialised in technical indicators, has identified this signal:
RSI indicator is back under 50
Type : Bearish
Timeframe : 15 minutes
The analysis of the price chart with Central Patterns scanners does not return any result.
The Central Candlesticks scanner currently notes the presence of this pattern in Japanese candlesticks that could mark the end of the short-term trend currently underway:
White gravestone / inverted hammer
Type : Neutral
Timeframe : 15 minutes
| S3 | S2 | S1 | Price | R1 | |
|---|---|---|---|---|---|
| ProTrendLines | 2,950.03 | 2,981.60 | 3,026.07 | 3,033.64 | 3,057.48 |
| Change (%) | -2.76% | -1.72% | -0.25% | - | +0.79% |
| Change | -83.61 | -52.04 | -7.57 | - | +23.84 |
| Level | Intermediate | Minor | Major | - | Intermediate |
Pivot points can also be used to set your price objectives. Here is the price situation in relation to pivot points:
| Pivot points | S3 | S2 | S1 | PP | R1 | R2 | R3 |
|---|---|---|---|---|---|---|---|
| Standard | 2,997.21 | 3,011.47 | 3,028.96 | 3,043.22 | 3,060.71 | 3,074.97 | 3,092.46 |
| Camarilla | 3,037.72 | 3,040.63 | 3,043.54 | 3,046.45 | 3,049.36 | 3,052.27 | 3,055.18 |
| Woodie | 2,998.83 | 3,012.28 | 3,030.58 | 3,044.03 | 3,062.33 | 3,075.78 | 3,094.08 |
| Fibonacci | 3,011.47 | 3,023.60 | 3,031.09 | 3,043.22 | 3,055.35 | 3,062.84 | 3,074.97 |
| Pivot points | S3 | S2 | S1 | PP | R1 | R2 | R3 |
|---|---|---|---|---|---|---|---|
| Standard | 2,780.70 | 2,830.49 | 2,905.37 | 2,955.16 | 3,030.04 | 3,079.83 | 3,154.71 |
| Camarilla | 2,945.97 | 2,957.39 | 2,968.82 | 2,980.25 | 2,991.68 | 3,003.11 | 3,014.53 |
| Woodie | 2,793.25 | 2,836.76 | 2,917.92 | 2,961.43 | 3,042.59 | 3,086.10 | 3,167.26 |
| Fibonacci | 2,830.49 | 2,878.11 | 2,907.54 | 2,955.16 | 3,002.78 | 3,032.21 | 3,079.83 |
| Pivot points | S3 | S2 | S1 | PP | R1 | R2 | R3 |
|---|---|---|---|---|---|---|---|
| Standard | 2,583.31 | 2,677.77 | 2,767.31 | 2,861.77 | 2,951.31 | 3,045.77 | 3,135.31 |
| Camarilla | 2,806.24 | 2,823.11 | 2,839.97 | 2,856.84 | 2,873.71 | 2,890.57 | 2,907.44 |
| Woodie | 2,580.84 | 2,676.54 | 2,764.84 | 2,860.54 | 2,948.84 | 3,044.54 | 3,132.84 |
| Fibonacci | 2,677.77 | 2,748.06 | 2,791.49 | 2,861.77 | 2,932.06 | 2,975.49 | 3,045.77 |
Numerical data
The following is the status of the technical indicators and moving averages at the time of publication of this technical analysis:
| RSI (14): | 46.99 | |
| MACD (12,26,9): | -0.4400 | |
| Directional Movement: | -5.59 | |
| AROON (14): | -7.15 | |
| DEMA (21): | 3,030.65 | |
| Parabolic SAR (0,02-0,02-0,2): | 3,034.71 | |
| Elder Ray (13): | -0.07 | |
| Super Trend (3,10): | 3,023.34 | |
| Zig ZAG (10): | 3,031.28 | |
| VORTEX (21): | 1.0400 | |
| Stochastique (14,3,5): | 56.63 | |
| TEMA (21): | 3,031.76 | |
| Williams %R (14): | -44.94 | |
| Chande Momentum Oscillator (20): | 2.65 | |
| Repulse (5,40,3): | 0.0400 | |
| ROCnROLL: | 2 | |
| TRIX (15,9): | 0.0000 | |
| Courbe Coppock: | 0.01 |
| MA7: | 3,017.99 | |
| MA20: | 2,946.52 | |
| MA50: | 2,868.18 | |
| MA100: | 2,758.42 | |
| MAexp7: | 3,031.41 | |
| MAexp20: | 3,031.42 | |
| MAexp50: | 3,033.53 | |
| MAexp100: | 3,036.11 | |
| Price / MA7: | +0.52% | |
| Price / MA20: | +2.96% | |
| Price / MA50: | +5.77% | |
| Price / MA100: | +9.98% | |
| Price / MAexp7: | +0.07% | |
| Price / MAexp20: | +0.07% | |
| Price / MAexp50: | +0.00% | |
| Price / MAexp100: | -0.08% |
News
Don't forget to follow the news on GOLD - USD. At the time of publication of this analysis, the latest news was as follows:
-
 XAU/USD Price Forecast Today, Technical Analysis (March 20): Gold Hits Record but Momentum Stalls
-
XAU/USD Price Forecast Today, Technical Analysis (March 20): Gold Continues to Bounce Around
-
XAU/USD Price Forecast Today, Technical Analysis (March 19): Gold Hits Yet Another All-Time High
-
XAU/USD Price Forecast Today, Technical Analysis (March 19): Gold Rallies Again on Wednesday
-
#YourQuestionsAnswered | Why is gold shooting up now that Trump is back?
About author

Online


Add a comment
Comments
0 comments on the analysis GOLD - USD - 15 min.