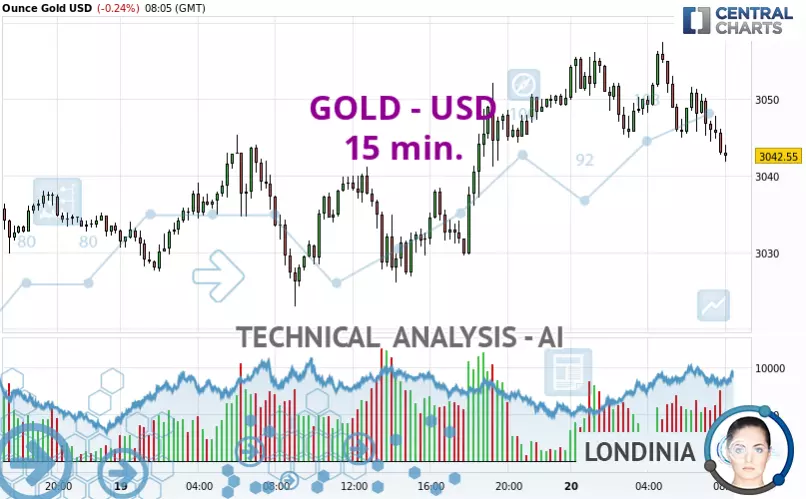
GOLD - USD - 15 min. - Technical analysis published on 03/20/2025 (GMT)
- 216
- 0
Click here for a new analysis!
- Timeframe : 15 min.
- - Analysis generated on
- Status : TARGET REACHED

Summary of the analysis

Additional analysis
Quotes
GOLD - USD rating 3,042.55 USD. On the day, this instrument lost -0.25% with the lowest point at 3,041.85 USD and the highest point at 3,057.48 USD. The deviation from the price is +0.02% for the low point and -0.49% for the high point.The Central Gaps scanner detects a bullish opening. A small advantage for buyers in the very short term.
Bullish opening
Type : Bullish
Timeframe : Openning
A study of price movements over other periods shows the following variations:
New HIGH record (5 years)
Type : Bullish
Timeframe : Weekly
New HIGH record (1 year)
Type : Bullish
Timeframe : Weekly
New HIGH record (1st january)
Type : Bullish
Timeframe : Weekly
New HIGH record (1 month)
Type : Bullish
Timeframe : Weekly
Technical
Technical analysis of GOLD - USD in 15 min. shows a neutral overall trend. The strong bearish signals currently being given by short-term moving averages could allow the overall trend to return to a bearish trend. An assessment of moving averages reveals a bearish signal that could impact this trend:
Moving Average bearish crossovers : MA20 & MA50
Type : Bearish
Timeframe : 15 minutes
In fact, according to the parameters integrated into the Central Analyzer system, 12 technical indicators out of 18 analysed are currently bearish. But beware of excesses. The Central Indicators scanner currently detects this:
CCI indicator is oversold : under -100
Type : Neutral
Timeframe : 15 minutes
Williams %R indicator is oversold : under -80
Type : Neutral
Timeframe : 15 minutes
Pivot points : price is over resistance 1 (Daily)
Type : Neutral
Timeframe : Weekly
RSI indicator is back under 50
Type : Bearish
Timeframe : 15 minutes
Pivot points : price is over resistance 1 (Weekly)
Type : Neutral
Timeframe : 15 minutes
Pivot points : price is over resistance 1 (Monthly)
Type : Neutral
Timeframe : 15 minutes
No signals are given by Central Patterns, a market scanner specialised in chart patterns, resistances and supports.
The presence of a bullish Japanese candlestick pattern detected by Central Candlesticks that could cause a very short term rebound was also detected:
Bullish harami
Type : Bullish
Timeframe : 15 minutes
| S3 | S2 | S1 | Price | R1 | |
|---|---|---|---|---|---|
| ProTrendLines | 2,932.50 | 2,950.03 | 2,981.60 | 3,042.55 | 3,045.38 |
| Change (%) | -3.62% | -3.04% | -2.00% | - | +0.09% |
| Change | -110.05 | -92.52 | -60.95 | - | +2.83 |
| Level | Minor | Minor | Minor | - | Intermediate |
Pivot points can also be used to set your price objectives. Here is the price situation in relation to pivot points:
| Pivot points | S3 | S2 | S1 | PP | R1 | R2 | R3 |
|---|---|---|---|---|---|---|---|
| Standard | 3,002.04 | 3,012.47 | 3,031.24 | 3,041.67 | 3,060.44 | 3,070.87 | 3,089.64 |
| Camarilla | 3,041.99 | 3,044.67 | 3,047.34 | 3,050.02 | 3,052.70 | 3,055.37 | 3,058.05 |
| Woodie | 3,006.22 | 3,014.56 | 3,035.42 | 3,043.76 | 3,064.62 | 3,072.96 | 3,093.82 |
| Fibonacci | 3,012.47 | 3,023.62 | 3,030.51 | 3,041.67 | 3,052.82 | 3,059.71 | 3,070.87 |
| Pivot points | S3 | S2 | S1 | PP | R1 | R2 | R3 |
|---|---|---|---|---|---|---|---|
| Standard | 2,780.70 | 2,830.49 | 2,905.37 | 2,955.16 | 3,030.04 | 3,079.83 | 3,154.71 |
| Camarilla | 2,945.97 | 2,957.39 | 2,968.82 | 2,980.25 | 2,991.68 | 3,003.11 | 3,014.53 |
| Woodie | 2,793.25 | 2,836.76 | 2,917.92 | 2,961.43 | 3,042.59 | 3,086.10 | 3,167.26 |
| Fibonacci | 2,830.49 | 2,878.11 | 2,907.54 | 2,955.16 | 3,002.78 | 3,032.21 | 3,079.83 |
| Pivot points | S3 | S2 | S1 | PP | R1 | R2 | R3 |
|---|---|---|---|---|---|---|---|
| Standard | 2,583.31 | 2,677.77 | 2,767.31 | 2,861.77 | 2,951.31 | 3,045.77 | 3,135.31 |
| Camarilla | 2,806.24 | 2,823.11 | 2,839.97 | 2,856.84 | 2,873.71 | 2,890.57 | 2,907.44 |
| Woodie | 2,580.84 | 2,676.54 | 2,764.84 | 2,860.54 | 2,948.84 | 3,044.54 | 3,132.84 |
| Fibonacci | 2,677.77 | 2,748.06 | 2,791.49 | 2,861.77 | 2,932.06 | 2,975.49 | 3,045.77 |
Numerical data
The following is the status of the technical indicators and moving averages at the time of publication of this technical analysis:
| RSI (14): | 41.87 | |
| MACD (12,26,9): | -0.5600 | |
| Directional Movement: | -8.75 | |
| AROON (14): | -78.57 | |
| DEMA (21): | 3,047.73 | |
| Parabolic SAR (0,02-0,02-0,2): | 3,051.78 | |
| Elder Ray (13): | -3.14 | |
| Super Trend (3,10): | 3,053.85 | |
| Zig ZAG (10): | 3,043.99 | |
| VORTEX (21): | 0.9400 | |
| Stochastique (14,3,5): | 10.31 | |
| TEMA (21): | 3,045.60 | |
| Williams %R (14): | -96.74 | |
| Chande Momentum Oscillator (20): | -9.07 | |
| Repulse (5,40,3): | -0.1500 | |
| ROCnROLL: | 2 | |
| TRIX (15,9): | 0.0000 | |
| Courbe Coppock: | 0.28 |
| MA7: | 3,004.31 | |
| MA20: | 2,941.82 | |
| MA50: | 2,861.29 | |
| MA100: | 2,755.93 | |
| MAexp7: | 3,045.57 | |
| MAexp20: | 3,048.89 | |
| MAexp50: | 3,047.33 | |
| MAexp100: | 3,042.73 | |
| Price / MA7: | +1.27% | |
| Price / MA20: | +3.42% | |
| Price / MA50: | +6.33% | |
| Price / MA100: | +10.40% | |
| Price / MAexp7: | -0.10% | |
| Price / MAexp20: | -0.21% | |
| Price / MAexp50: | -0.16% | |
| Price / MAexp100: | -0.01% |
News
The latest news and videos published on GOLD - USD at the time of the analysis were as follows:
-
 XAU/USD Price Forecast Today, Technical Analysis (March 19): Gold Hits Yet Another All-Time High
-
XAU/USD Price Forecast Today, Technical Analysis (March 19): Gold Rallies Again on Wednesday
-
#YourQuestionsAnswered | Why is gold shooting up now that Trump is back?
-
XAU/USD Price Forecast Today, Technical Analysis (March 18): Gold Hits New Record High
-
Gold Analysis: Is Gold Going to Make it to $3300?
About author

Online


Add a comment
Comments
0 comments on the analysis GOLD - USD - 15 min.