GOLD - USD - 15 min. - Technical analysis published on 03/19/2025 (GMT)
- 82
- 0
Click here for a new analysis!
- Timeframe : 15 min.
- - Analysis generated on
- Status : LEVEL MAINTAINED

Summary of the analysis

Additional analysis
Quotes
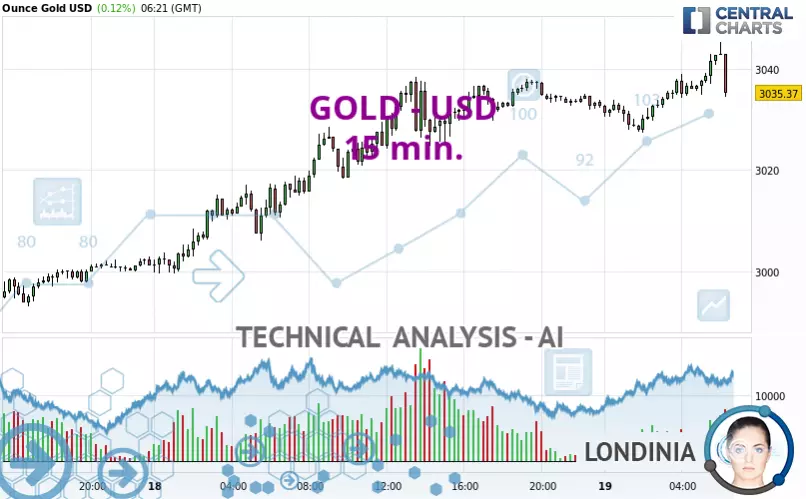
The GOLD - USD price is 3,035.13 USD. The price has increased by +0.11% since the last closing and was traded between 3,027.46 USD and 3,045.38 USD over the period. The price is currently at +0.25% from its lowest and -0.34% from its highest.The Central Gaps scanner detects a bearish opening. A small advantage for sellers in the very short term.
Bearish opening
Type : Bearish
Timeframe : Openning
A study of price movements over other periods shows the following variations:
New HIGH record (5 years)
Type : Bullish
Timeframe : Weekly
New HIGH record (1 year)
Type : Bullish
Timeframe : Weekly
New HIGH record (1st january)
Type : Bullish
Timeframe : Weekly
New HIGH record (1 month)
Type : Bullish
Timeframe : Weekly
Technical
A technical analysis in 15 min. of this GOLD - USD chart shows a bullish trend. The signals given by moving averages are 78.57% bullish. This bullish trend could slow down given the neutral signals currently being given by short-term moving averages. The Central Indicators market scanner currently does not detect any result that concerns moving averages.
The probability of a further increase are moderate given the direction of the technical indicators.
Caution: the Central Indicators scanner currently detects an excess:
RSI indicator is overbought : over 70
Type : Neutral
Timeframe : 15 minutes
Pivot points : price is over resistance 1 (Daily)
Type : Neutral
Timeframe : Weekly
Pivot points : price is over resistance 1 (Weekly)
Type : Neutral
Timeframe : 15 minutes
Pivot points : price is over resistance 1 (Monthly)
Type : Neutral
Timeframe : 15 minutes
No signals are given by Central Patterns, a market scanner specialised in chart patterns, resistances and supports.
No result was found by the Central Candlesticks scanner on Japanese candlesticks.
| S3 | S2 | S1 | Price | R1 | |
|---|---|---|---|---|---|
| ProTrendLines | 2,930.38 | 2,950.03 | 2,999.82 | 3,035.13 | 3,038.32 |
| Change (%) | -3.45% | -2.80% | -1.16% | - | +0.11% |
| Change | -104.75 | -85.10 | -35.31 | - | +3.19 |
| Level | Minor | Minor | Intermediate | - | Intermediate |
Pivot points can also be used to set your price objectives. Here is the price situation in relation to pivot points:
| Pivot points | S3 | S2 | S1 | PP | R1 | R2 | R3 |
|---|---|---|---|---|---|---|---|
| Standard | 2,969.16 | 2,984.31 | 3,008.09 | 3,023.24 | 3,047.02 | 3,062.17 | 3,085.95 |
| Camarilla | 3,021.16 | 3,024.73 | 3,028.30 | 3,031.87 | 3,035.44 | 3,039.01 | 3,042.58 |
| Woodie | 2,973.48 | 2,986.47 | 3,012.41 | 3,025.40 | 3,051.34 | 3,064.33 | 3,090.27 |
| Fibonacci | 2,984.31 | 2,999.18 | 3,008.37 | 3,023.24 | 3,038.11 | 3,047.30 | 3,062.17 |
| Pivot points | S3 | S2 | S1 | PP | R1 | R2 | R3 |
|---|---|---|---|---|---|---|---|
| Standard | 2,780.70 | 2,830.49 | 2,905.37 | 2,955.16 | 3,030.04 | 3,079.83 | 3,154.71 |
| Camarilla | 2,945.97 | 2,957.39 | 2,968.82 | 2,980.25 | 2,991.68 | 3,003.11 | 3,014.53 |
| Woodie | 2,793.25 | 2,836.76 | 2,917.92 | 2,961.43 | 3,042.59 | 3,086.10 | 3,167.26 |
| Fibonacci | 2,830.49 | 2,878.11 | 2,907.54 | 2,955.16 | 3,002.78 | 3,032.21 | 3,079.83 |
| Pivot points | S3 | S2 | S1 | PP | R1 | R2 | R3 |
|---|---|---|---|---|---|---|---|
| Standard | 2,583.31 | 2,677.77 | 2,767.31 | 2,861.77 | 2,951.31 | 3,045.77 | 3,135.31 |
| Camarilla | 2,806.24 | 2,823.11 | 2,839.97 | 2,856.84 | 2,873.71 | 2,890.57 | 2,907.44 |
| Woodie | 2,580.84 | 2,676.54 | 2,764.84 | 2,860.54 | 2,948.84 | 3,044.54 | 3,132.84 |
| Fibonacci | 2,677.77 | 2,748.06 | 2,791.49 | 2,861.77 | 2,932.06 | 2,975.49 | 3,045.77 |
Numerical data
The following are the details of the technical indicators and moving averages that were collected to generate this technical analysis:
| RSI (14): | 57.00 | |
| MACD (12,26,9): | 2.0400 | |
| Directional Movement: | 11.08 | |
| AROON (14): | 78.57 | |
| DEMA (21): | 3,039.01 | |
| Parabolic SAR (0,02-0,02-0,2): | 3,045.38 | |
| Elder Ray (13): | 1.59 | |
| Super Trend (3,10): | 3,035.14 | |
| Zig ZAG (10): | 3,038.01 | |
| VORTEX (21): | 1.1400 | |
| Stochastique (14,3,5): | 63.04 | |
| TEMA (21): | 3,040.31 | |
| Williams %R (14): | -52.52 | |
| Chande Momentum Oscillator (20): | 3.91 | |
| Repulse (5,40,3): | -0.1000 | |
| ROCnROLL: | 1 | |
| TRIX (15,9): | 0.0100 | |
| Courbe Coppock: | 0.47 |
| MA7: | 2,984.37 | |
| MA20: | 2,936.04 | |
| MA50: | 2,853.61 | |
| MA100: | 2,753.15 | |
| MAexp7: | 3,039.13 | |
| MAexp20: | 3,036.83 | |
| MAexp50: | 3,033.87 | |
| MAexp100: | 3,028.03 | |
| Price / MA7: | +1.70% | |
| Price / MA20: | +3.37% | |
| Price / MA50: | +6.36% | |
| Price / MA100: | +10.24% | |
| Price / MAexp7: | -0.13% | |
| Price / MAexp20: | -0.06% | |
| Price / MAexp50: | +0.04% | |
| Price / MAexp100: | +0.23% |
News
The last news published on GOLD - USD at the time of the generation of this analysis was as follows:
-
 XAU/USD Price Forecast Today, Technical Analysis (March 18): Gold Hits New Record High
-
Gold Analysis: Is Gold Going to Make it to $3300?
-
Gold (XAU/USD) Daily Price Forecast and Technical Analysis, March 18, 2025, #gold #xauusd #xau
-
XAU/USD Price Forecast Today, Technical Analysis (March 17): Gold Attemps to Break Above $3000
-
XAU/USD Price Forecast Today, Technical Analysis (March 14): Gold Rallied to a New Record High
About author

Online


Add a comment
Comments
0 comments on the analysis GOLD - USD - 15 min.