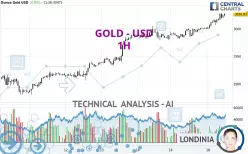
GOLD - USD - 1H - Technical analysis published on 03/18/2025 (GMT)
- 84
- 0
Click here for a new analysis!
- Timeframe : 1H
- - Analysis generated on
- Status : LEVEL MAINTAINED

Summary of the analysis

Additional analysis
Quotes
The GOLD - USD rating is 3,026.80 USD. The price registered an increase of +0.90% on the session with the lowest point at 2,999.46 USD and the highest point at 3,028.50 USD. The deviation from the price is +0.91% for the low point and -0.06% for the high point.The Central Gaps scanner detects a bullish opening. A small advantage for buyers in the very short term.
Bullish opening
Type : Bullish
Timeframe : Openning
A study of price movements over other periods shows the following variations:
New HIGH record (5 years)
Type : Bullish
Timeframe : Weekly
New HIGH record (1 year)
Type : Bullish
Timeframe : Weekly
New HIGH record (1st january)
Type : Bullish
Timeframe : Weekly
New HIGH record (1 month)
Type : Bullish
Timeframe : Weekly
Technical
Technical analysis of GOLD - USD in 1H shows a strongly overall bullish trend. 92.86% of the signals given by moving averages are bullish. The overall trend is supported by the strong bullish signals from short-term moving averages. There is no crossing of moving average by the price or crossing of moving averages between themselves.
In fact, 14 technical indicators on 18 studied are currently positioned bullish. But beware of excesses. The Central Indicators scanner currently detects this:
RSI indicator is overbought : over 70
Type : Neutral
Timeframe : 1 hour
CCI indicator is overbought : over 100
Type : Neutral
Timeframe : 1 hour
Williams %R indicator is overbought : over -20
Type : Neutral
Timeframe : 1 hour
Pivot points : price is over resistance 2 (Daily)
Type : Neutral
Timeframe : 1 hour
Central Patterns, the scanner specializing in chart patterns, did not identify any signals.
The Central Candlesticks scanner which studies Japanese candlesticks did not detect anything.
| S3 | S2 | S1 | Price | |
|---|---|---|---|---|
| ProTrendLines | 2,950.03 | 2,984.89 | 3,004.95 | 3,026.80 |
| Change (%) | -2.54% | -1.38% | -0.72% | - |
| Change | -76.77 | -41.91 | -21.85 | - |
| Level | Minor | Minor | Intermediate | - |
Attention could also be paid to pivot points to set price objectives:
| Pivot points | S3 | S2 | S1 | PP | R1 | R2 | R3 |
|---|---|---|---|---|---|---|---|
| Standard | 2,966.39 | 2,974.30 | 2,987.08 | 2,994.99 | 3,007.77 | 3,015.68 | 3,028.46 |
| Camarilla | 2,994.17 | 2,996.07 | 2,997.96 | 2,999.86 | 3,001.76 | 3,003.65 | 3,005.55 |
| Woodie | 2,968.83 | 2,975.52 | 2,989.52 | 2,996.21 | 3,010.21 | 3,016.90 | 3,030.90 |
| Fibonacci | 2,974.30 | 2,982.20 | 2,987.09 | 2,994.99 | 3,002.89 | 3,007.78 | 3,015.68 |
| Pivot points | S3 | S2 | S1 | PP | R1 | R2 | R3 |
|---|---|---|---|---|---|---|---|
| Standard | 2,780.70 | 2,830.49 | 2,905.37 | 2,955.16 | 3,030.04 | 3,079.83 | 3,154.71 |
| Camarilla | 2,945.97 | 2,957.39 | 2,968.82 | 2,980.25 | 2,991.68 | 3,003.11 | 3,014.53 |
| Woodie | 2,793.25 | 2,836.76 | 2,917.92 | 2,961.43 | 3,042.59 | 3,086.10 | 3,167.26 |
| Fibonacci | 2,830.49 | 2,878.11 | 2,907.54 | 2,955.16 | 3,002.78 | 3,032.21 | 3,079.83 |
| Pivot points | S3 | S2 | S1 | PP | R1 | R2 | R3 |
|---|---|---|---|---|---|---|---|
| Standard | 2,583.31 | 2,677.77 | 2,767.31 | 2,861.77 | 2,951.31 | 3,045.77 | 3,135.31 |
| Camarilla | 2,806.24 | 2,823.11 | 2,839.97 | 2,856.84 | 2,873.71 | 2,890.57 | 2,907.44 |
| Woodie | 2,580.84 | 2,676.54 | 2,764.84 | 2,860.54 | 2,948.84 | 3,044.54 | 3,132.84 |
| Fibonacci | 2,677.77 | 2,748.06 | 2,791.49 | 2,861.77 | 2,932.06 | 2,975.49 | 3,045.77 |
Numerical data
The following is the status of technical indicators and moving averages registered at the time this technical analysis was created:
| RSI (14): | 70.22 | |
| MACD (12,26,9): | 8.1600 | |
| Directional Movement: | 21.38 | |
| AROON (14): | 57.14 | |
| DEMA (21): | 3,021.13 | |
| Parabolic SAR (0,02-0,02-0,2): | 3,018.22 | |
| Elder Ray (13): | 9.03 | |
| Super Trend (3,10): | 3,005.29 | |
| Zig ZAG (10): | 3,024.11 | |
| VORTEX (21): | 1.3100 | |
| Stochastique (14,3,5): | 80.90 | |
| TEMA (21): | 3,024.26 | |
| Williams %R (14): | -14.39 | |
| Chande Momentum Oscillator (20): | 24.43 | |
| Repulse (5,40,3): | 0.1400 | |
| ROCnROLL: | 1 | |
| TRIX (15,9): | 0.0300 | |
| Courbe Coppock: | 1.39 |
| MA7: | 2,961.40 | |
| MA20: | 2,930.46 | |
| MA50: | 2,845.92 | |
| MA100: | 2,750.12 | |
| MAexp7: | 3,020.23 | |
| MAexp20: | 3,010.98 | |
| MAexp50: | 2,997.49 | |
| MAexp100: | 2,978.67 | |
| Price / MA7: | +2.21% | |
| Price / MA20: | +3.29% | |
| Price / MA50: | +6.36% | |
| Price / MA100: | +10.06% | |
| Price / MAexp7: | +0.22% | |
| Price / MAexp20: | +0.53% | |
| Price / MAexp50: | +0.98% | |
| Price / MAexp100: | +1.62% |
News
The last news published on GOLD - USD at the time of the generation of this analysis was as follows:
-
 XAU/USD Price Forecast Today, Technical Analysis (March 17): Gold Attemps to Break Above $3000
-
XAU/USD Price Forecast Today, Technical Analysis (March 14): Gold Rallied to a New Record High
-
XAU/USD Price Forecast Today, Technical Analysis (March 13): Gold Breaks Out to Record Highs
-
XAU/USD Price Forecast Today, Technical Analysis (March 13): Gold Continues to Climb
-
XAU/USD Price Forecast Today, Technical Analysis (March 12): Gold Eyes New Record Highs
About author

Online


Add a comment
Comments
0 comments on the analysis GOLD - USD - 1H