GOLD - USD - 15 min. - Technical analysis published on 03/18/2025 (GMT)
- 240
- 0
Click here for a new analysis!
- Timeframe : 15 min.
- - Analysis generated on
- Status : TARGET REACHED

Summary of the analysis

Additional analysis
Quotes
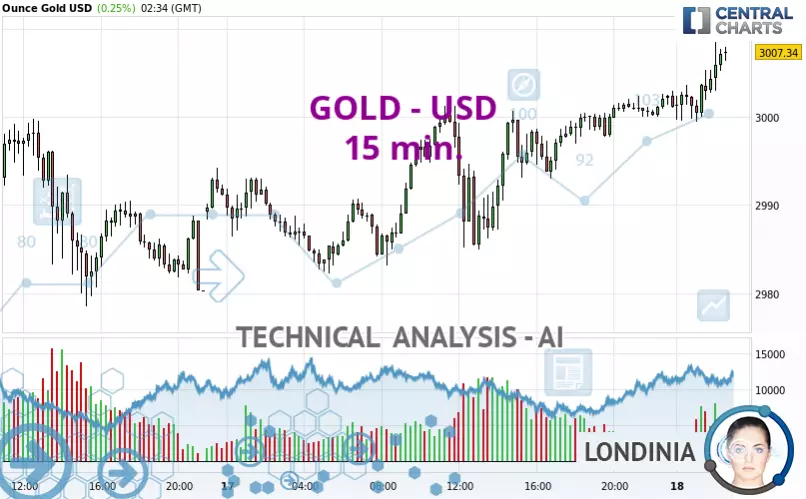
The GOLD - USD rating is 3,007.40 USD. The price has increased by +0.25% since the last closing and was between 2,999.46 USD and 3,008.48 USD. This implies that the price is at +0.26% from its lowest and at -0.04% from its highest.The Central Gaps scanner detects a bullish opening marking the presence of buyers ahead of sellers at the opening but not sufficiently marked to allow the price to register a quotation gap.
Bullish opening
Type : Bullish
Timeframe : Openning
A study of price movements over other periods shows the following variations:
New HIGH record (5 years)
Type : Bullish
Timeframe : Weekly
New HIGH record (1 year)
Type : Bullish
Timeframe : Weekly
New HIGH record (1st january)
Type : Bullish
Timeframe : Weekly
New HIGH record (1 month)
Type : Bullish
Timeframe : Weekly
Technical
Technical analysis of GOLD - USD in 15 min. shows a strongly overall bullish trend. 92.86% of the signals given by moving averages are bullish. The overall trend is supported by the strong bullish signals from short-term moving averages. The Central Indicators scanner does not detect any result on moving averages that would impact this trend.
In fact, according to the parameters integrated into the Central Analyzer system, 13 technical indicators out of 18 analysed are currently bullish. Caution: the Central Indicators scanner currently detects an excess:
RSI indicator is overbought : over 70
Type : Neutral
Timeframe : 15 minutes
CCI indicator is overbought : over 100
Type : Neutral
Timeframe : 15 minutes
Previous candle closed over Bollinger bands
Type : Neutral
Timeframe : 15 minutes
The analysis of the price chart with Central Patterns scanners does not return any result.
The Central Candlesticks scanner, specialised in Japanese candlesticks, did not identify any signals.
| S3 | S2 | S1 | Price | |
|---|---|---|---|---|
| ProTrendLines | 2,950.03 | 2,984.89 | 3,004.95 | 3,007.40 |
| Change (%) | -1.91% | -0.75% | -0.08% | - |
| Change | -57.37 | -22.51 | -2.45 | - |
| Level | Minor | Minor | Intermediate | - |
To determine price objectives, it is also possible to use the pivot points. Here is the price position in relation to pivot points:
| Pivot points | S3 | S2 | S1 | PP | R1 | R2 | R3 |
|---|---|---|---|---|---|---|---|
| Standard | 2,966.39 | 2,974.30 | 2,987.08 | 2,994.99 | 3,007.77 | 3,015.68 | 3,028.46 |
| Camarilla | 2,994.17 | 2,996.07 | 2,997.96 | 2,999.86 | 3,001.76 | 3,003.65 | 3,005.55 |
| Woodie | 2,968.83 | 2,975.52 | 2,989.52 | 2,996.21 | 3,010.21 | 3,016.90 | 3,030.90 |
| Fibonacci | 2,974.30 | 2,982.20 | 2,987.09 | 2,994.99 | 3,002.89 | 3,007.78 | 3,015.68 |
| Pivot points | S3 | S2 | S1 | PP | R1 | R2 | R3 |
|---|---|---|---|---|---|---|---|
| Standard | 2,780.70 | 2,830.49 | 2,905.37 | 2,955.16 | 3,030.04 | 3,079.83 | 3,154.71 |
| Camarilla | 2,945.97 | 2,957.39 | 2,968.82 | 2,980.25 | 2,991.68 | 3,003.11 | 3,014.53 |
| Woodie | 2,793.25 | 2,836.76 | 2,917.92 | 2,961.43 | 3,042.59 | 3,086.10 | 3,167.26 |
| Fibonacci | 2,830.49 | 2,878.11 | 2,907.54 | 2,955.16 | 3,002.78 | 3,032.21 | 3,079.83 |
| Pivot points | S3 | S2 | S1 | PP | R1 | R2 | R3 |
|---|---|---|---|---|---|---|---|
| Standard | 2,583.31 | 2,677.77 | 2,767.31 | 2,861.77 | 2,951.31 | 3,045.77 | 3,135.31 |
| Camarilla | 2,806.24 | 2,823.11 | 2,839.97 | 2,856.84 | 2,873.71 | 2,890.57 | 2,907.44 |
| Woodie | 2,580.84 | 2,676.54 | 2,764.84 | 2,860.54 | 2,948.84 | 3,044.54 | 3,132.84 |
| Fibonacci | 2,677.77 | 2,748.06 | 2,791.49 | 2,861.77 | 2,932.06 | 2,975.49 | 3,045.77 |
Numerical data
The following is the status of technical indicators and moving averages registered at the time this technical analysis was created:
| RSI (14): | 70.52 | |
| MACD (12,26,9): | 1.6800 | |
| Directional Movement: | 15.93 | |
| AROON (14): | 21.42 | |
| DEMA (21): | 3,004.74 | |
| Parabolic SAR (0,02-0,02-0,2): | 3,000.72 | |
| Elder Ray (13): | 2.59 | |
| Super Trend (3,10): | 2,998.35 | |
| Zig ZAG (10): | 3,006.32 | |
| VORTEX (21): | 1.1100 | |
| Stochastique (14,3,5): | 72.28 | |
| TEMA (21): | 3,005.25 | |
| Williams %R (14): | -22.73 | |
| Chande Momentum Oscillator (20): | 4.82 | |
| Repulse (5,40,3): | 0.1200 | |
| ROCnROLL: | 1 | |
| TRIX (15,9): | 0.0100 | |
| Courbe Coppock: | 0.24 |
| MA7: | 2,958.84 | |
| MA20: | 2,929.53 | |
| MA50: | 2,845.56 | |
| MA100: | 2,749.94 | |
| MAexp7: | 3,004.59 | |
| MAexp20: | 3,002.16 | |
| MAexp50: | 2,999.24 | |
| MAexp100: | 2,995.40 | |
| Price / MA7: | +1.64% | |
| Price / MA20: | +2.66% | |
| Price / MA50: | +5.69% | |
| Price / MA100: | +9.36% | |
| Price / MAexp7: | +0.09% | |
| Price / MAexp20: | +0.17% | |
| Price / MAexp50: | +0.27% | |
| Price / MAexp100: | +0.40% |
News
The last news published on GOLD - USD at the time of the generation of this analysis was as follows:
-
 XAU/USD Price Forecast Today, Technical Analysis (March 17): Gold Attemps to Break Above $3000
-
XAU/USD Price Forecast Today, Technical Analysis (March 14): Gold Rallied to a New Record High
-
XAU/USD Price Forecast Today, Technical Analysis (March 13): Gold Breaks Out to Record Highs
-
XAU/USD Price Forecast Today, Technical Analysis (March 13): Gold Continues to Climb
-
XAU/USD Price Forecast Today, Technical Analysis (March 12): Gold Eyes New Record Highs
About author

Online


Add a comment
Comments
0 comments on the analysis GOLD - USD - 15 min.