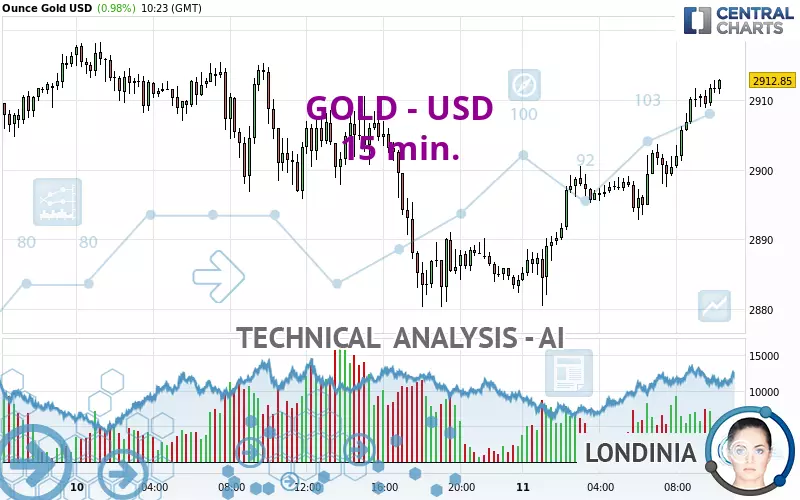
GOLD - USD - 15 min. - Technical analysis published on 03/11/2025 (GMT)
- 75
- 0
Click here for a new analysis!
- Timeframe : 15 min.
- - Analysis generated on
- Status : LEVEL MAINTAINED

Summary of the analysis

Additional analysis
Quotes
The GOLD - USD rating is 2,912.85 USD. On the day, this instrument gained +0.98% and was between 2,880.47 USD and 2,913.01 USD. This implies that the price is at +1.12% from its lowest and at -0.01% from its highest.A bearish opening was detected by the Central Gaps scanner. Sellers are trying to impose a bearish trend in the very short term.
Bearish opening
Type : Bearish
Timeframe : Openning
Here is a more detailed summary of the historical variations registered by GOLD - USD:
Near a new HIGH record (5 years)
Type : Bullish
Timeframe : Weekly
Near a new HIGH record (1 year)
Type : Bullish
Timeframe : Weekly
Near a new HIGH record (1st january)
Type : Bullish
Timeframe : Weekly
Near a new HIGH record (1 month)
Type : Bullish
Timeframe : Weekly
Technical
Technical analysis of this 15 min. chart of GOLD - USD indicates that the overall trend is strongly bullish. 89.29% of the signals given by moving averages are bullish. This strongly bullish trend is supported by the strong bullish signals given by short-term moving averages. The Central Indicators market scanner currently does not detect any result that concerns moving averages.
In fact, 13 technical indicators on 18 studied are currently positioned bullish. Caution: the Central Indicators scanner currently detects an excess:
RSI indicator is overbought : over 70
Type : Neutral
Timeframe : 15 minutes
CCI indicator is overbought : over 100
Type : Neutral
Timeframe : 15 minutes
Williams %R indicator is overbought : over -20
Type : Neutral
Timeframe : 15 minutes
Pivot points : price is over resistance 1 (Daily)
Type : Neutral
Timeframe : 15 minutes
Central Patterns, the scanner specializing in chart patterns, did not identify any signals.
Central Candlesticks, the scanner specialised in Japanese candlesticks, detects a bearish signal that could support the hypothesis of a small drop in the very short term:
Bearish engulfing lines
Type : Bearish
Timeframe : 15 minutes
| S3 | S2 | S1 | Price | R1 | R2 | |
|---|---|---|---|---|---|---|
| ProTrendLines | 2,884.74 | 2,902.08 | 2,910.52 | 2,912.85 | 2,930.15 | 2,950.03 |
| Change (%) | -0.97% | -0.37% | -0.08% | - | +0.59% | +1.28% |
| Change | -28.11 | -10.77 | -2.33 | - | +17.30 | +37.18 |
| Level | Minor | Intermediate | Minor | - | Major | Intermediate |
Pivot points can also be used to set your price objectives. Here is the price situation in relation to pivot points:
| Pivot points | S3 | S2 | S1 | PP | R1 | R2 | R3 |
|---|---|---|---|---|---|---|---|
| Standard | 2,832.49 | 2,856.38 | 2,870.52 | 2,894.41 | 2,908.55 | 2,932.44 | 2,946.58 |
| Camarilla | 2,874.19 | 2,877.68 | 2,881.16 | 2,884.65 | 2,888.14 | 2,891.62 | 2,895.11 |
| Woodie | 2,827.61 | 2,853.94 | 2,865.64 | 2,891.97 | 2,903.67 | 2,930.00 | 2,941.70 |
| Fibonacci | 2,856.38 | 2,870.91 | 2,879.89 | 2,894.41 | 2,908.94 | 2,917.92 | 2,932.44 |
| Pivot points | S3 | S2 | S1 | PP | R1 | R2 | R3 |
|---|---|---|---|---|---|---|---|
| Standard | 2,795.65 | 2,826.29 | 2,869.04 | 2,899.68 | 2,942.43 | 2,973.07 | 3,015.82 |
| Camarilla | 2,891.60 | 2,898.33 | 2,905.05 | 2,911.78 | 2,918.51 | 2,925.24 | 2,931.96 |
| Woodie | 2,801.70 | 2,829.32 | 2,875.09 | 2,902.71 | 2,948.48 | 2,976.10 | 3,021.87 |
| Fibonacci | 2,826.29 | 2,854.33 | 2,871.65 | 2,899.68 | 2,927.72 | 2,945.04 | 2,973.07 |
| Pivot points | S3 | S2 | S1 | PP | R1 | R2 | R3 |
|---|---|---|---|---|---|---|---|
| Standard | 2,583.31 | 2,677.77 | 2,767.31 | 2,861.77 | 2,951.31 | 3,045.77 | 3,135.31 |
| Camarilla | 2,806.24 | 2,823.11 | 2,839.97 | 2,856.84 | 2,873.71 | 2,890.57 | 2,907.44 |
| Woodie | 2,580.84 | 2,676.54 | 2,764.84 | 2,860.54 | 2,948.84 | 3,044.54 | 3,132.84 |
| Fibonacci | 2,677.77 | 2,748.06 | 2,791.49 | 2,861.77 | 2,932.06 | 2,975.49 | 3,045.77 |
Numerical data
The following is the status of technical indicators and moving averages registered at the time this technical analysis was created:
| RSI (14): | 78.32 | |
| MACD (12,26,9): | 4.4400 | |
| Directional Movement: | 19.97 | |
| AROON (14): | 78.57 | |
| DEMA (21): | 2,911.37 | |
| Parabolic SAR (0,02-0,02-0,2): | 2,907.68 | |
| Elder Ray (13): | 3.94 | |
| Super Trend (3,10): | 2,904.00 | |
| Zig ZAG (10): | 2,912.75 | |
| VORTEX (21): | 1.2300 | |
| Stochastique (14,3,5): | 95.31 | |
| TEMA (21): | 2,913.42 | |
| Williams %R (14): | -2.00 | |
| Chande Momentum Oscillator (20): | 12.33 | |
| Repulse (5,40,3): | 0.0900 | |
| ROCnROLL: | 1 | |
| TRIX (15,9): | 0.0200 | |
| Courbe Coppock: | 0.84 |
| MA7: | 2,906.14 | |
| MA20: | 2,911.57 | |
| MA50: | 2,811.43 | |
| MA100: | 2,737.52 | |
| MAexp7: | 2,910.59 | |
| MAexp20: | 2,905.79 | |
| MAexp50: | 2,900.59 | |
| MAexp100: | 2,900.20 | |
| Price / MA7: | +0.23% | |
| Price / MA20: | +0.04% | |
| Price / MA50: | +3.61% | |
| Price / MA100: | +6.40% | |
| Price / MAexp7: | +0.08% | |
| Price / MAexp20: | +0.24% | |
| Price / MAexp50: | +0.42% | |
| Price / MAexp100: | +0.44% |
News
The latest news and videos published on GOLD - USD at the time of the analysis were as follows:
-
 XAU/USD Price Forecast Today, Technical Analysis (March 10): Gold Continues to Build a Flag
-
XAU/USD Price Forecast Today, Technical Analysis (March 07): Gold Continues to Consolidate
-
BREAKING: Cyclone Alfred closes in on Australia's Gold Coast
-
XAU/USD Price Forecast Today, Technical Analysis (March 06): Gold Holds Near Highs
-
XAU/USD Price Forecast Today, Technical Analysis (March 06): Gold Pulls Back Slightly
About author

Online


Add a comment
Comments
0 comments on the analysis GOLD - USD - 15 min.