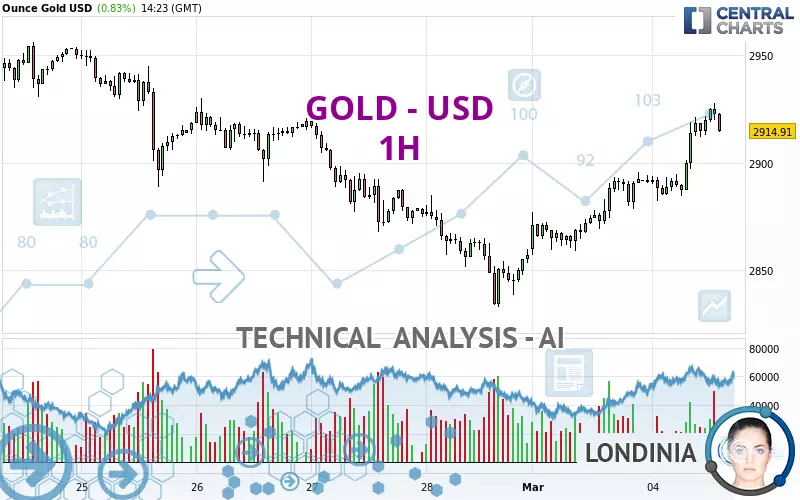
GOLD - USD - 1H - Technical analysis published on 03/04/2025 (GMT)
- 42
- 0
- Timeframe : 1H
- - Analysis generated on
- Status : IN PROGRESS...

Summary of the analysis

Additional analysis
Quotes
GOLD - USD rating 2,914.81 USD. The price registered an increase of +0.82% on the session and was traded between 2,881.93 USD and 2,927.91 USD over the period. The price is currently at +1.14% from its lowest and -0.45% from its highest.The Central Gaps scanner detects a bullish opening. A small advantage for buyers in the very short term.
Bullish opening
Type : Bullish
Timeframe : Openning
So that you have an overall view of the price change, here is a table showing the variations over several periods:
Near a new HIGH record (5 years)
Type : Bullish
Timeframe : Weekly
Near a new HIGH record (1 year)
Type : Bullish
Timeframe : Weekly
Near a new HIGH record (1st january)
Type : Bullish
Timeframe : Weekly
Near a new LOW record (1 month)
Type : Bearish
Timeframe : Weekly
Technical
Technical analysis of GOLD - USD in 1H shows a strongly overall bullish trend. The signals given by the moving averages are 85.71% bullish. This strong bullish trend is confirmed by the strong signals currently being given by short-term moving averages. The Central Indicators scanner does not detect any result on moving averages that would impact this trend.
An assessment of technical indicators shows a strong bullish signal.
Caution: the Central Indicators scanner currently detects an excess:
RSI indicator is overbought : over 70
Type : Neutral
Timeframe : 1 hour
CCI indicator is overbought : over 100
Type : Neutral
Timeframe : 1 hour
Williams %R indicator is overbought : over -20
Type : Neutral
Timeframe : 1 hour
Pivot points : price is over resistance 1
Type : Neutral
Timeframe : 1 hour
Price is back over the pivot point
Type : Bullish
Timeframe : Weekly
The analysis of the price chart with Central Patterns scanners does not return any result.
The Central Candlesticks scanner which studies Japanese candlesticks did not detect anything.
| S3 | S2 | S1 | Price | R1 | R2 | |
|---|---|---|---|---|---|---|
| ProTrendLines | 2,832.65 | 2,867.84 | 2,883.61 | 2,914.81 | 2,921.19 | 2,950.03 |
| Change (%) | -2.82% | -1.61% | -1.07% | - | +0.22% | +1.21% |
| Change | -82.16 | -46.97 | -31.20 | - | +6.38 | +35.22 |
| Level | Minor | Minor | Major | - | Minor | Major |
Attention could also be paid to pivot points to set price objectives:
| Pivot points | S3 | S2 | S1 | PP | R1 | R2 | R3 |
|---|---|---|---|---|---|---|---|
| Standard | 2,828.39 | 2,842.67 | 2,866.83 | 2,881.11 | 2,905.27 | 2,919.55 | 2,943.71 |
| Camarilla | 2,880.43 | 2,883.95 | 2,887.48 | 2,891.00 | 2,894.52 | 2,898.05 | 2,901.57 |
| Woodie | 2,833.34 | 2,845.14 | 2,871.78 | 2,883.58 | 2,910.22 | 2,922.02 | 2,948.66 |
| Fibonacci | 2,842.67 | 2,857.35 | 2,866.42 | 2,881.11 | 2,895.79 | 2,904.86 | 2,919.55 |
| Pivot points | S3 | S2 | S1 | PP | R1 | R2 | R3 |
|---|---|---|---|---|---|---|---|
| Standard | 2,683.99 | 2,758.32 | 2,807.58 | 2,881.91 | 2,931.17 | 3,005.50 | 3,054.76 |
| Camarilla | 2,822.85 | 2,834.18 | 2,845.51 | 2,856.84 | 2,868.17 | 2,879.50 | 2,890.83 |
| Woodie | 2,671.46 | 2,752.05 | 2,795.05 | 2,875.64 | 2,918.64 | 2,999.23 | 3,042.23 |
| Fibonacci | 2,758.32 | 2,805.53 | 2,834.70 | 2,881.91 | 2,929.12 | 2,958.29 | 3,005.50 |
| Pivot points | S3 | S2 | S1 | PP | R1 | R2 | R3 |
|---|---|---|---|---|---|---|---|
| Standard | 2,583.31 | 2,677.77 | 2,767.31 | 2,861.77 | 2,951.31 | 3,045.77 | 3,135.31 |
| Camarilla | 2,806.24 | 2,823.11 | 2,839.97 | 2,856.84 | 2,873.71 | 2,890.57 | 2,907.44 |
| Woodie | 2,580.84 | 2,676.54 | 2,764.84 | 2,860.54 | 2,948.84 | 3,044.54 | 3,132.84 |
| Fibonacci | 2,677.77 | 2,748.06 | 2,791.49 | 2,861.77 | 2,932.06 | 2,975.49 | 3,045.77 |
Numerical data
The following is the status of technical indicators and moving averages registered at the time this technical analysis was created:
| RSI (14): | 70.85 | |
| MACD (12,26,9): | 11.7900 | |
| Directional Movement: | 24.42 | |
| AROON (14): | 85.72 | |
| DEMA (21): | 2,917.66 | |
| Parabolic SAR (0,02-0,02-0,2): | 2,901.35 | |
| Elder Ray (13): | 11.84 | |
| Super Trend (3,10): | 2,898.51 | |
| Zig ZAG (10): | 2,920.23 | |
| VORTEX (21): | 1.2000 | |
| Stochastique (14,3,5): | 90.17 | |
| TEMA (21): | 2,923.59 | |
| Williams %R (14): | -18.49 | |
| Chande Momentum Oscillator (20): | 33.52 | |
| Repulse (5,40,3): | 0.0300 | |
| ROCnROLL: | 1 | |
| TRIX (15,9): | 0.0500 | |
| Courbe Coppock: | 1.88 |
| MA7: | 2,904.19 | |
| MA20: | 2,905.29 | |
| MA50: | 2,782.63 | |
| MA100: | 2,726.22 | |
| MAexp7: | 2,915.98 | |
| MAexp20: | 2,903.36 | |
| MAexp50: | 2,890.40 | |
| MAexp100: | 2,891.15 | |
| Price / MA7: | +0.37% | |
| Price / MA20: | +0.33% | |
| Price / MA50: | +4.75% | |
| Price / MA100: | +6.92% | |
| Price / MAexp7: | -0.04% | |
| Price / MAexp20: | +0.39% | |
| Price / MAexp50: | +0.84% | |
| Price / MAexp100: | +0.82% |
News
Don't forget to follow the news on GOLD - USD. At the time of publication of this analysis, the latest news was as follows:
-
 XAU/USD Price Forecast Today, Technical Analysis (March 03): Gold Rallies to Kick Off the Week
-
XAU/USD Price Forecast Today, Technical Analysis (February 28): Gold Drops to New Low
-
XAU/USD Weekly Forecast, Technical Analysis (Mar 03 - 07): Gold Has a Horrible Week
-
XAU/USD Price Forecast Today, Technical Analysis (February 28): Gold Fell Pretty Significantly
-
XAU/USD Price Forecast Today, Technical Analysis (February 27): Gold Triggered a Bearish Reversal
About author

Online


Add a comment
Comments
0 comments on the analysis GOLD - USD - 1H