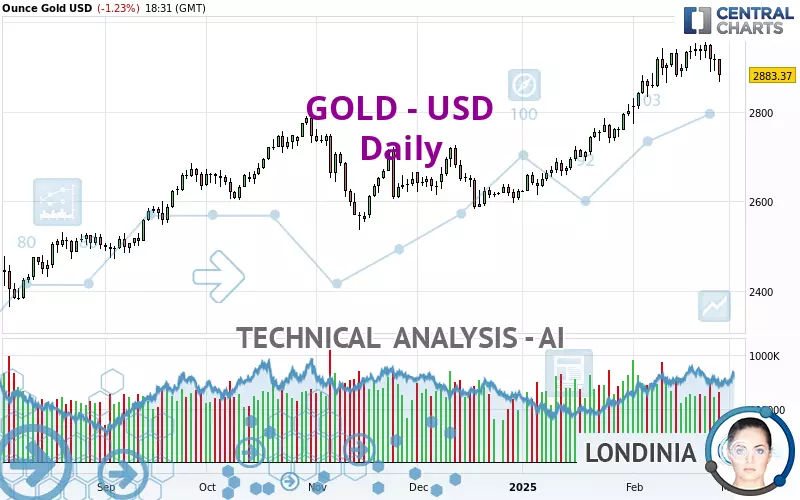
GOLD - USD - Daily - Technical analysis published on 02/27/2025 (GMT)
- 130
- 0
- Timeframe : Daily
- - Analysis generated on
- Status : IN PROGRESS...
Summary of the analysis

Additional analysis
Quotes
The GOLD - USD rating is 2,883.33 USD. On the day, this instrument lost -1.23% and was between 2,867.84 USD and 2,919.30 USD. This implies that the price is at +0.54% from its lowest and at -1.23% from its highest.The Central Gaps scanner detects a bullish opening. A small advantage for buyers in the very short term.
Bullish opening
Type : Bullish
Timeframe : Openning
A study of price movements over other periods shows the following variations:
New HIGH record (5 years)
Type : Bullish
Timeframe : Weekly
Near a new HIGH record (1 year)
Type : Bullish
Timeframe : Weekly
Near a new HIGH record (1st january)
Type : Bullish
Timeframe : Weekly
Near a new LOW record (1 month)
Type : Bearish
Timeframe : Weekly
Technical
A technical analysis in Daily of this GOLD - USD chart shows a bullish trend. 78.57% of the signals given by moving averages are bullish. Caution: the neutral signals currently given by short-term moving averages show us that the global trend is losing momentum. An assessment of moving averages reveals several bearish signals that could impact this trend:
Bearish price crossover with Moving Average 20
Type : Bearish
Timeframe : Daily
Bearish price crossover with adaptative moving average 20
Type : Bearish
Timeframe : Daily
The probability of a further decline is low given the direction of the technical indicators.
Central Indicators, the detector scanner for these technical indicators has recently detected several signals:
Pivot points : price is under support 1
Type : Neutral
Timeframe : Daily
Pivot points : price is under support 1
Type : Neutral
Timeframe : Weekly
Momentum indicator is back under 0
Type : Bearish
Timeframe : Daily
Williams %R indicator is back under -50
Type : Bearish
Timeframe : Daily
Central Patterns, the scanner specializing in chart patterns, did not identify any signals.
Central Candlesticks, the scanner specialised in Japanese candlesticks, detects a bearish signal that could support the hypothesis of a small drop in the very short term:
Bearish engulfing lines
Type : Bearish
Timeframe : Daily
| S3 | S2 | S1 | Price | |
|---|---|---|---|---|
| ProTrendLines | 2,588.23 | 2,720.21 | 2,785.43 | 2,883.33 |
| Change (%) | -10.23% | -5.66% | -3.40% | - |
| Change | -295.10 | -163.12 | -97.90 | - |
| Level | Intermediate | Intermediate | Minor | - |
Pivot points can also be used to set your price objectives. Here is the price situation in relation to pivot points:
| Pivot points | S3 | S2 | S1 | PP | R1 | R2 | R3 |
|---|---|---|---|---|---|---|---|
| Standard | 2,857.40 | 2,874.13 | 2,896.70 | 2,913.43 | 2,936.00 | 2,952.73 | 2,975.30 |
| Camarilla | 2,908.45 | 2,912.06 | 2,915.66 | 2,919.26 | 2,922.86 | 2,926.47 | 2,930.07 |
| Woodie | 2,860.31 | 2,875.59 | 2,899.61 | 2,914.89 | 2,938.91 | 2,954.19 | 2,978.21 |
| Fibonacci | 2,874.13 | 2,889.15 | 2,898.42 | 2,913.43 | 2,928.45 | 2,937.72 | 2,952.73 |
| Pivot points | S3 | S2 | S1 | PP | R1 | R2 | R3 |
|---|---|---|---|---|---|---|---|
| Standard | 2,815.13 | 2,846.83 | 2,891.55 | 2,923.25 | 2,967.97 | 2,999.67 | 3,044.39 |
| Camarilla | 2,915.26 | 2,922.26 | 2,929.27 | 2,936.27 | 2,943.28 | 2,950.28 | 2,957.29 |
| Woodie | 2,821.64 | 2,850.09 | 2,898.06 | 2,926.51 | 2,974.48 | 3,002.93 | 3,050.90 |
| Fibonacci | 2,846.83 | 2,876.02 | 2,894.06 | 2,923.25 | 2,952.44 | 2,970.48 | 2,999.67 |
| Pivot points | S3 | S2 | S1 | PP | R1 | R2 | R3 |
|---|---|---|---|---|---|---|---|
| Standard | 2,469.07 | 2,541.90 | 2,671.55 | 2,744.38 | 2,874.03 | 2,946.86 | 3,076.51 |
| Camarilla | 2,745.53 | 2,764.09 | 2,782.65 | 2,801.21 | 2,819.77 | 2,838.33 | 2,856.89 |
| Woodie | 2,497.49 | 2,556.11 | 2,699.97 | 2,758.59 | 2,902.45 | 2,961.07 | 3,104.93 |
| Fibonacci | 2,541.90 | 2,619.24 | 2,667.03 | 2,744.38 | 2,821.72 | 2,869.51 | 2,946.86 |
Numerical data
The following is the status of technical indicators and moving averages registered at the time this technical analysis was created:
| RSI (14): | 54.78 | |
| MACD (12,26,9): | 43.5200 | |
| Directional Movement: | 5.09 | |
| AROON (14): | 78.57 | |
| DEMA (21): | 2,946.56 | |
| Parabolic SAR (0,02-0,02-0,2): | 2,954.88 | |
| Elder Ray (13): | -12.23 | |
| Super Trend (3,10): | 2,824.60 | |
| Zig ZAG (10): | 2,886.76 | |
| VORTEX (21): | 1.1400 | |
| Stochastique (14,3,5): | 54.86 | |
| TEMA (21): | 2,947.82 | |
| Williams %R (14): | -69.21 | |
| Chande Momentum Oscillator (20): | -13.48 | |
| Repulse (5,40,3): | -0.8800 | |
| ROCnROLL: | -1 | |
| TRIX (15,9): | 0.2800 | |
| Courbe Coppock: | 4.72 |
| MA7: | 2,926.86 | |
| MA20: | 2,895.03 | |
| MA50: | 2,765.50 | |
| MA100: | 2,718.60 | |
| MAexp7: | 2,914.99 | |
| MAexp20: | 2,884.12 | |
| MAexp50: | 2,803.73 | |
| MAexp100: | 2,723.44 | |
| Price / MA7: | -1.49% | |
| Price / MA20: | -0.40% | |
| Price / MA50: | +4.26% | |
| Price / MA100: | +6.06% | |
| Price / MAexp7: | -1.09% | |
| Price / MAexp20: | -0.03% | |
| Price / MAexp50: | +2.84% | |
| Price / MAexp100: | +5.87% |
News
Don't forget to follow the news on GOLD - USD. At the time of publication of this analysis, the latest news was as follows:
-
 XAU/USD Price Forecast Today, Technical Analysis (February 27): Gold Plunges Early on Thursday
-
Technical Analysis on BTCUSD, Gold, Oil
-
XAU/USD Price Forecast Today, Technical Analysis (February 26): Gold Markets Stabilize a Bit
-
How could Trump’s new ‘Gold Card’ immigration plan stimulate the US economy?
-
XAU/USD Price Forecast Today, Technical Analysis (February 25): Gold Fails to Follow Breakout
About author

Online


Add a comment
Comments
0 comments on the analysis GOLD - USD - Daily