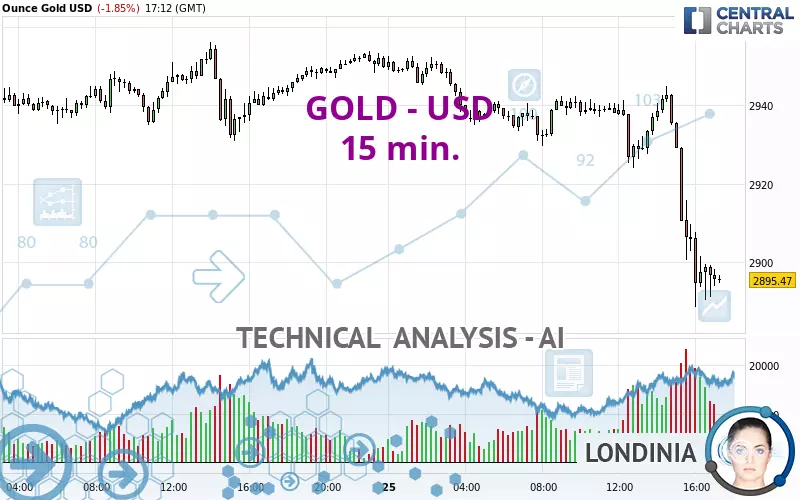
GOLD - USD - 15 min. - Technical analysis published on 02/25/2025 (GMT)
- 60
- 0
- Timeframe : 15 min.
- - Analysis generated on
- Status : IN PROGRESS...

Summary of the analysis

Additional analysis
Quotes
GOLD - USD rating 2,895.41 USD. The price registered a decrease of -1.85% on the session and was traded between 2,888.44 USD and 2,952.62 USD over the period. The price is currently at +0.24% from its lowest and -1.94% from its highest.The Central Gaps scanner detects a bullish opening marking the presence of buyers ahead of sellers at the opening but not sufficiently marked to allow the price to register a quotation gap.
Bullish opening
Type : Bullish
Timeframe : Openning
Here is a more detailed summary of the historical variations registered by GOLD - USD:
New HIGH record (5 years)
Type : Bullish
Timeframe : Weekly
Near a new HIGH record (1 year)
Type : Bullish
Timeframe : Weekly
Near a new HIGH record (1st january)
Type : Bullish
Timeframe : Weekly
Near a new HIGH record (1 month)
Type : Bullish
Timeframe : Weekly
Technical
Technical analysis of GOLD - USD in 15 min. shows a overall strongly bearish trend. 92.86% of the signals given by moving averages are bearish. This strongly bearish trend is supported by the strong bearish signals given by short-term moving averages. The Central Indicators market scanner currently does not detect any result that concerns moving averages.
In fact, 12 technical indicators on 18 studied are currently positioned bearish. But beware of excesses. The Central Indicators scanner currently detects this:
RSI indicator is oversold : under 30
Type : Neutral
Timeframe : 15 minutes
CCI indicator is oversold : under -100
Type : Neutral
Timeframe : 15 minutes
Williams %R indicator is oversold : under -80
Type : Neutral
Timeframe : 15 minutes
Pivot points : price is under support 3
Type : Neutral
Timeframe : 15 minutes
Price is back under the pivot point
Type : Bearish
Timeframe : Weekly
The analysis of the price chart with Central Patterns scanners does not return any result.
No result was found by the Central Candlesticks scanner on Japanese candlesticks.
| S3 | S2 | S1 | Price | R1 | R2 | R3 | |
|---|---|---|---|---|---|---|---|
| ProTrendLines | 2,720.21 | 2,785.43 | 2,877.00 | 2,895.41 | 2,906.24 | 2,923.98 | 2,940.00 |
| Change (%) | -6.05% | -3.80% | -0.64% | - | +0.37% | +0.99% | +1.54% |
| Change | -175.20 | -109.98 | -18.41 | - | +10.83 | +28.57 | +44.59 |
| Level | Intermediate | Minor | Minor | - | Minor | Intermediate | Intermediate |
Pivot points can also be used to set your price objectives. Here is the price situation in relation to pivot points:
| Pivot points | S3 | S2 | S1 | PP | R1 | R2 | R3 |
|---|---|---|---|---|---|---|---|
| Standard | 2,893.85 | 2,907.57 | 2,928.80 | 2,942.52 | 2,963.75 | 2,977.47 | 2,998.70 |
| Camarilla | 2,940.42 | 2,943.62 | 2,946.83 | 2,950.03 | 2,953.23 | 2,956.44 | 2,959.64 |
| Woodie | 2,897.61 | 2,909.45 | 2,932.56 | 2,944.40 | 2,967.51 | 2,979.35 | 3,002.46 |
| Fibonacci | 2,907.57 | 2,920.92 | 2,929.17 | 2,942.52 | 2,955.87 | 2,964.12 | 2,977.47 |
| Pivot points | S3 | S2 | S1 | PP | R1 | R2 | R3 |
|---|---|---|---|---|---|---|---|
| Standard | 2,815.13 | 2,846.83 | 2,891.55 | 2,923.25 | 2,967.97 | 2,999.67 | 3,044.39 |
| Camarilla | 2,915.26 | 2,922.26 | 2,929.27 | 2,936.27 | 2,943.28 | 2,950.28 | 2,957.29 |
| Woodie | 2,821.64 | 2,850.09 | 2,898.06 | 2,926.51 | 2,974.48 | 3,002.93 | 3,050.90 |
| Fibonacci | 2,846.83 | 2,876.02 | 2,894.06 | 2,923.25 | 2,952.44 | 2,970.48 | 2,999.67 |
| Pivot points | S3 | S2 | S1 | PP | R1 | R2 | R3 |
|---|---|---|---|---|---|---|---|
| Standard | 2,469.07 | 2,541.90 | 2,671.55 | 2,744.38 | 2,874.03 | 2,946.86 | 3,076.51 |
| Camarilla | 2,745.53 | 2,764.09 | 2,782.65 | 2,801.21 | 2,819.77 | 2,838.33 | 2,856.89 |
| Woodie | 2,497.49 | 2,556.11 | 2,699.97 | 2,758.59 | 2,902.45 | 2,961.07 | 3,104.93 |
| Fibonacci | 2,541.90 | 2,619.24 | 2,667.03 | 2,744.38 | 2,821.72 | 2,869.51 | 2,946.86 |
Numerical data
The following is the status of technical indicators and moving averages registered at the time this technical analysis was created:
| RSI (14): | 24.45 | |
| MACD (12,26,9): | -10.2100 | |
| Directional Movement: | -39.22 | |
| AROON (14): | -42.85 | |
| DEMA (21): | 2,908.21 | |
| Parabolic SAR (0,02-0,02-0,2): | 2,930.61 | |
| Elder Ray (13): | -19.07 | |
| Super Trend (3,10): | 2,919.30 | |
| Zig ZAG (10): | 2,895.31 | |
| VORTEX (21): | 0.6900 | |
| Stochastique (14,3,5): | 11.28 | |
| TEMA (21): | 2,896.95 | |
| Williams %R (14): | -91.42 | |
| Chande Momentum Oscillator (20): | -44.19 | |
| Repulse (5,40,3): | -0.3400 | |
| ROCnROLL: | 2 | |
| TRIX (15,9): | -0.0300 | |
| Courbe Coppock: | 2.13 |
| MA7: | 2,927.74 | |
| MA20: | 2,881.60 | |
| MA50: | 2,754.98 | |
| MA100: | 2,712.99 | |
| MAexp7: | 2,901.76 | |
| MAexp20: | 2,919.94 | |
| MAexp50: | 2,930.27 | |
| MAexp100: | 2,935.53 | |
| Price / MA7: | -1.10% | |
| Price / MA20: | +0.48% | |
| Price / MA50: | +5.10% | |
| Price / MA100: | +6.72% | |
| Price / MAexp7: | -0.22% | |
| Price / MAexp20: | -0.84% | |
| Price / MAexp50: | -1.19% | |
| Price / MAexp100: | -1.37% |
News
The latest news and videos published on GOLD - USD at the time of the analysis were as follows:
-
 Gold isn't trading like it used to — what investors need to understand
-
XAU/USD Price Forecast Today, Technical Analysis (February 25): Gold Continues to Consolidate
-
US$ and where is Gold heading, crude whipsaws
-
Trump announces he and Elon Musk will visit Fort Knox "to check whether the gold is still there."
-
XAU/USD Weekly Forecast, Technical Analysis (Feb 24 - 28): Gold Has Another Positive Week
About author

Online


Add a comment
Comments
0 comments on the analysis GOLD - USD - 15 min.