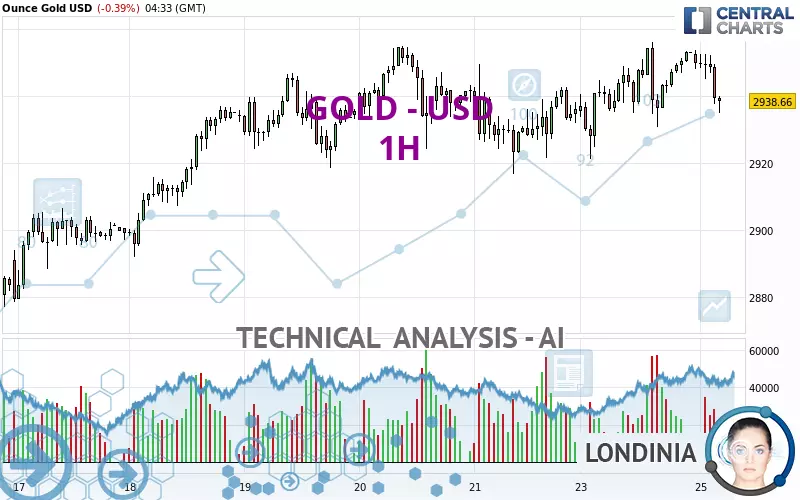
GOLD - USD - 1H - Technical analysis published on 02/25/2025 (GMT)
- 68
- 0
- Timeframe : 1H
- - Analysis generated on
- Status : IN PROGRESS...

Summary of the analysis

Additional analysis
Quotes
The GOLD - USD price is 2,938.66 USD. On the day, this instrument lost -0.39% and was traded between 2,935.11 USD and 2,952.62 USD over the period. The price is currently at +0.12% from its lowest and -0.47% from its highest.A bullish opening was detected by the Central Gaps scanner. Buyers are trying to impose a bullish momentum in the very short term.
Bullish opening
Type : Bullish
Timeframe : Openning
A study of price movements over other periods shows the following variations:
New HIGH record (5 years)
Type : Bullish
Timeframe : Weekly
Near a new HIGH record (1 year)
Type : Bullish
Timeframe : Weekly
Near a new HIGH record (1st january)
Type : Bullish
Timeframe : Weekly
Near a new HIGH record (1 month)
Type : Bullish
Timeframe : Weekly
Technical
A technical analysis in 1H of this GOLD - USD chart shows a slightly bullish trend. 57.14% of the signals given by moving averages are bullish. Caution: the strong bearish signals currently being given by short-term moving averages indicate that this slightly bullish trend could be reversed. An assessment of moving averages reveals several bearish signals that could impact this trend:
Bearish trend reversal : Moving Average 20
Type : Bearish
Timeframe : 1 hour
Bearish trend reversal : adaptative moving average 20
Type : Bearish
Timeframe : 1 hour
Bearish trend reversal : adaptative moving average 50
Type : Bearish
Timeframe : 1 hour
Bearish price crossover with Moving Average 50
Type : Bearish
Timeframe : 1 hour
Bearish price crossover with Moving Average 100
Type : Bearish
Timeframe : 1 hour
Bearish price crossover with adaptative moving average 50
Type : Bearish
Timeframe : 1 hour
An assessment of technical indicators does not currently provide any relevant information to suggest whether the signal given by the technical indicators is more bullish or bearish.
Caution: the Central Indicators scanner currently detects an excess:
CCI indicator is oversold : under -100
Type : Neutral
Timeframe : 1 hour
Momentum indicator is back under 0
Type : Bearish
Timeframe : 1 hour
No signals are given by Central Patterns, a market scanner specialised in chart patterns, resistances and supports.
Central Candlesticks, the scanner specialised in Japanese candlesticks, detects a bearish signal that could support the hypothesis of a small drop in the very short term:
Three black crows
Type : Bearish
Timeframe : 1 hour
| S3 | S2 | S1 | Price | R1 | R2 | R3 | |
|---|---|---|---|---|---|---|---|
| ProTrendLines | 2,877.00 | 2,906.24 | 2,923.98 | 2,938.66 | 2,940.00 | 2,949.76 | 2,956.24 |
| Change (%) | -2.10% | -1.10% | -0.50% | - | +0.05% | +0.38% | +0.60% |
| Change | -61.66 | -32.42 | -14.68 | - | +1.34 | +11.10 | +17.58 |
| Level | Minor | Minor | Intermediate | - | Intermediate | Minor | Intermediate |
Attention could also be paid to pivot points to set price objectives:
| Pivot points | S3 | S2 | S1 | PP | R1 | R2 | R3 |
|---|---|---|---|---|---|---|---|
| Standard | 2,893.85 | 2,907.57 | 2,928.80 | 2,942.52 | 2,963.75 | 2,977.47 | 2,998.70 |
| Camarilla | 2,940.42 | 2,943.62 | 2,946.83 | 2,950.03 | 2,953.23 | 2,956.44 | 2,959.64 |
| Woodie | 2,897.61 | 2,909.45 | 2,932.56 | 2,944.40 | 2,967.51 | 2,979.35 | 3,002.46 |
| Fibonacci | 2,907.57 | 2,920.92 | 2,929.17 | 2,942.52 | 2,955.87 | 2,964.12 | 2,977.47 |
| Pivot points | S3 | S2 | S1 | PP | R1 | R2 | R3 |
|---|---|---|---|---|---|---|---|
| Standard | 2,815.13 | 2,846.83 | 2,891.55 | 2,923.25 | 2,967.97 | 2,999.67 | 3,044.39 |
| Camarilla | 2,915.26 | 2,922.26 | 2,929.27 | 2,936.27 | 2,943.28 | 2,950.28 | 2,957.29 |
| Woodie | 2,821.64 | 2,850.09 | 2,898.06 | 2,926.51 | 2,974.48 | 3,002.93 | 3,050.90 |
| Fibonacci | 2,846.83 | 2,876.02 | 2,894.06 | 2,923.25 | 2,952.44 | 2,970.48 | 2,999.67 |
| Pivot points | S3 | S2 | S1 | PP | R1 | R2 | R3 |
|---|---|---|---|---|---|---|---|
| Standard | 2,469.07 | 2,541.90 | 2,671.55 | 2,744.38 | 2,874.03 | 2,946.86 | 3,076.51 |
| Camarilla | 2,745.53 | 2,764.09 | 2,782.65 | 2,801.21 | 2,819.77 | 2,838.33 | 2,856.89 |
| Woodie | 2,497.49 | 2,556.11 | 2,699.97 | 2,758.59 | 2,902.45 | 2,961.07 | 3,104.93 |
| Fibonacci | 2,541.90 | 2,619.24 | 2,667.03 | 2,744.38 | 2,821.72 | 2,869.51 | 2,946.86 |
Numerical data
The following is the status of the technical indicators and moving averages at the time of publication of this technical analysis:
| RSI (14): | 41.25 | |
| MACD (12,26,9): | 1.2100 | |
| Directional Movement: | -14.65 | |
| AROON (14): | -7.14 | |
| DEMA (21): | 2,947.36 | |
| Parabolic SAR (0,02-0,02-0,2): | 2,933.04 | |
| Elder Ray (13): | -7.72 | |
| Super Trend (3,10): | 2,933.95 | |
| Zig ZAG (10): | 2,938.29 | |
| VORTEX (21): | 0.9800 | |
| Stochastique (14,3,5): | 45.47 | |
| TEMA (21): | 2,946.74 | |
| Williams %R (14): | -69.70 | |
| Chande Momentum Oscillator (20): | -5.61 | |
| Repulse (5,40,3): | -0.3400 | |
| ROCnROLL: | 2 | |
| TRIX (15,9): | 0.0100 | |
| Courbe Coppock: | 0.14 |
| MA7: | 2,933.43 | |
| MA20: | 2,883.58 | |
| MA50: | 2,755.77 | |
| MA100: | 2,713.39 | |
| MAexp7: | 2,944.52 | |
| MAexp20: | 2,944.89 | |
| MAexp50: | 2,941.49 | |
| MAexp100: | 2,936.21 | |
| Price / MA7: | +0.18% | |
| Price / MA20: | +1.91% | |
| Price / MA50: | +6.64% | |
| Price / MA100: | +8.30% | |
| Price / MAexp7: | -0.20% | |
| Price / MAexp20: | -0.21% | |
| Price / MAexp50: | -0.10% | |
| Price / MAexp100: | +0.08% |
News
The latest news and videos published on GOLD - USD at the time of the analysis were as follows:
-
 Trump announces he and Elon Musk will visit Fort Knox "to check whether the gold is still there."
-
XAU/USD Weekly Forecast, Technical Analysis (Feb 24 - 28): Gold Has Another Positive Week
-
XAU/USD Price Forecast Today, Technical Analysis (February 21): Gold Looks Noisy and Bullish
-
XAU/USD Price Forecast Today, Technical Analysis (February 20): Gold Hits Record High Again
-
XAU/USD Price Forecast Today, Technical Analysis (February 20): Gold Pressures to the Upside
About author

Online


Add a comment
Comments
0 comments on the analysis GOLD - USD - 1H