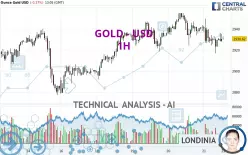
GOLD - USD - 1H - Technical analysis published on 02/21/2025 (GMT)
- 81
- 0
- Timeframe : 1H
- - Analysis generated on
- Status : IN PROGRESS...

Summary of the analysis

Additional analysis
Quotes
The GOLD - USD price is 2,930.59 USD. The price registered a decrease of -0.37% on the session and was traded between 2,916.78 USD and 2,949.76 USD over the period. The price is currently at +0.47% from its lowest and -0.65% from its highest.The Central Gaps scanner detects a bullish opening. A small advantage for buyers in the very short term.
Bullish opening
Type : Bullish
Timeframe : Openning
Here is a more detailed summary of the historical variations registered by GOLD - USD:
New HIGH record (5 years)
Type : Bullish
Timeframe : Weekly
Near a new HIGH record (1 year)
Type : Bullish
Timeframe : Weekly
Near a new HIGH record (1st january)
Type : Bullish
Timeframe : Weekly
Near a new HIGH record (1 month)
Type : Bullish
Timeframe : Weekly
Technical
Technical analysis of this 1H chart of GOLD - USD indicates that the overall trend is not clearly defined. This indecision could turn into a bearish trend due to the strong bearish signals currently being given by short-term moving averages. There is no crossing of moving average by the price or crossing of moving averages between themselves.
The technical indicators are generally neutral. They do not provide relevant information on the direction of future price movements.
Caution: the Central Indicators scanner currently detects an excess:
MACD indicator: bullish divergence
Type : Bullish
Timeframe : 1 hour
Pivot points : price is over resistance 1
Type : Neutral
Timeframe : Weekly
The analysis of the price chart with Central Patterns scanners does not return any result.
No result was found by the Central Candlesticks scanner on Japanese candlesticks.
| S3 | S2 | S1 | Price | R1 | R2 | R3 | |
|---|---|---|---|---|---|---|---|
| ProTrendLines | 2,877.00 | 2,906.38 | 2,924.02 | 2,930.59 | 2,940.00 | 2,947.09 | 2,954.95 |
| Change (%) | -1.83% | -0.83% | -0.22% | - | +0.32% | +0.56% | +0.83% |
| Change | -53.59 | -24.21 | -6.57 | - | +9.41 | +16.50 | +24.36 |
| Level | Minor | Intermediate | Intermediate | - | Minor | Minor | Intermediate |
Pivot points can also be used to set your price objectives. Here is the price situation in relation to pivot points:
| Pivot points | S3 | S2 | S1 | PP | R1 | R2 | R3 |
|---|---|---|---|---|---|---|---|
| Standard | 2,894.66 | 2,909.39 | 2,925.49 | 2,940.22 | 2,956.32 | 2,971.05 | 2,987.15 |
| Camarilla | 2,933.11 | 2,935.94 | 2,938.76 | 2,941.59 | 2,944.42 | 2,947.24 | 2,950.07 |
| Woodie | 2,895.35 | 2,909.73 | 2,926.18 | 2,940.56 | 2,957.01 | 2,971.39 | 2,987.84 |
| Fibonacci | 2,909.39 | 2,921.17 | 2,928.44 | 2,940.22 | 2,952.00 | 2,959.27 | 2,971.05 |
| Pivot points | S3 | S2 | S1 | PP | R1 | R2 | R3 |
|---|---|---|---|---|---|---|---|
| Standard | 2,756.75 | 2,805.78 | 2,844.70 | 2,893.73 | 2,932.65 | 2,981.68 | 3,020.60 |
| Camarilla | 2,859.42 | 2,867.49 | 2,875.55 | 2,883.61 | 2,891.67 | 2,899.73 | 2,907.80 |
| Woodie | 2,751.69 | 2,803.25 | 2,839.64 | 2,891.20 | 2,927.59 | 2,979.15 | 3,015.54 |
| Fibonacci | 2,805.78 | 2,839.38 | 2,860.14 | 2,893.73 | 2,927.33 | 2,948.09 | 2,981.68 |
| Pivot points | S3 | S2 | S1 | PP | R1 | R2 | R3 |
|---|---|---|---|---|---|---|---|
| Standard | 2,469.07 | 2,541.90 | 2,671.55 | 2,744.38 | 2,874.03 | 2,946.86 | 3,076.51 |
| Camarilla | 2,745.53 | 2,764.09 | 2,782.65 | 2,801.21 | 2,819.77 | 2,838.33 | 2,856.89 |
| Woodie | 2,497.49 | 2,556.11 | 2,699.97 | 2,758.59 | 2,902.45 | 2,961.07 | 3,104.93 |
| Fibonacci | 2,541.90 | 2,619.24 | 2,667.03 | 2,744.38 | 2,821.72 | 2,869.51 | 2,946.86 |
Numerical data
The following is the status of the technical indicators and moving averages at the time of publication of this technical analysis:
| RSI (14): | 43.63 | |
| MACD (12,26,9): | -3.0100 | |
| Directional Movement: | -9.89 | |
| AROON (14): | -50.00 | |
| DEMA (21): | 2,929.47 | |
| Parabolic SAR (0,02-0,02-0,2): | 2,943.52 | |
| Elder Ray (13): | -2.35 | |
| Super Trend (3,10): | 2,950.18 | |
| Zig ZAG (10): | 2,930.60 | |
| VORTEX (21): | 0.9700 | |
| Stochastique (14,3,5): | 39.97 | |
| TEMA (21): | 2,926.71 | |
| Williams %R (14): | -57.22 | |
| Chande Momentum Oscillator (20): | -9.55 | |
| Repulse (5,40,3): | 0.0300 | |
| ROCnROLL: | 2 | |
| TRIX (15,9): | -0.0100 | |
| Courbe Coppock: | 0.67 |
| MA7: | 2,922.47 | |
| MA20: | 2,864.07 | |
| MA50: | 2,744.50 | |
| MA100: | 2,707.54 | |
| MAexp7: | 2,930.13 | |
| MAexp20: | 2,932.82 | |
| MAexp50: | 2,933.86 | |
| MAexp100: | 2,928.45 | |
| Price / MA7: | +0.28% | |
| Price / MA20: | +2.32% | |
| Price / MA50: | +6.78% | |
| Price / MA100: | +8.24% | |
| Price / MAexp7: | +0.02% | |
| Price / MAexp20: | -0.08% | |
| Price / MAexp50: | -0.11% | |
| Price / MAexp100: | +0.07% |
News
The last news published on GOLD - USD at the time of the generation of this analysis was as follows:
-
 XAU/USD Price Forecast Today, Technical Analysis (February 20): Gold Hits Record High Again
-
XAU/USD Price Forecast Today, Technical Analysis (February 20): Gold Pressures to the Upside
-
XAU/USD Price Forecast Today, Technical Analysis (February 19): Gold Hits New Record High
-
Gold Analysis: Can Gold Continue to Rise?
-
XAU/USD Price Forecast Today, Technical Analysis (February 19): Gold Continues to Look Bullish
About author

Online


Add a comment
Comments
0 comments on the analysis GOLD - USD - 1H