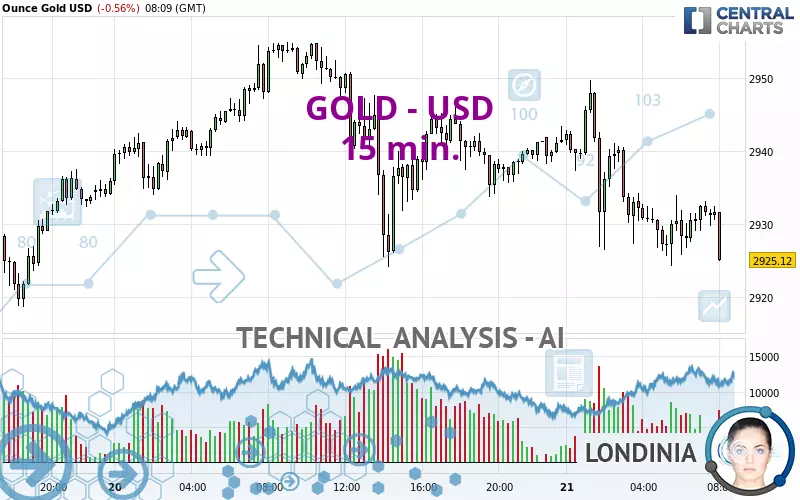
GOLD - USD - 15 min. - Technical analysis published on 02/21/2025 (GMT)
- 92
- 0
Click here for a new analysis!
- Timeframe : 15 min.
- - Analysis generated on
- Status : LEVEL MAINTAINED
Summary of the analysis

Additional analysis
Quotes
GOLD - USD rating 2,925.15 USD. On the day, this instrument lost -0.56% and was between 2,924.27 USD and 2,949.76 USD. This implies that the price is at +0.03% from its lowest and at -0.83% from its highest.The Central Gaps scanner detects a bullish opening. A small advantage for buyers in the very short term.
Bullish opening
Type : Bullish
Timeframe : Openning
So that you have an overall view of the price change, here is a table showing the variations over several periods:
New HIGH record (5 years)
Type : Bullish
Timeframe : Weekly
Near a new HIGH record (1 year)
Type : Bullish
Timeframe : Weekly
Near a new HIGH record (1st january)
Type : Bullish
Timeframe : Weekly
Near a new HIGH record (1 month)
Type : Bullish
Timeframe : Weekly
Technical
Technical analysis of GOLD - USD in 15 min. shows a overall strongly bearish trend. 92.86% of the signals given by moving averages are bearish. The overall trend is supported by the strong bearish signals from short-term moving averages. The Central Indicators scanner detects a bullish signal on moving averages that could impact this trend:
Bullish price crossover with Moving Average 20
Type : Bullish
Timeframe : 15 minutes
Technical indicators are slightly bullish. There is therefore considerable uncertainty about the continuation of the increase.
Caution: the Central Indicators scanner currently detects an excess:
Williams %R indicator is overbought : over -20
Type : Neutral
Timeframe : 15 minutes
Price is back over the pivot point
Type : Bullish
Timeframe : Weekly
Central Patterns, the scanner specializing in chart patterns, did not identify any signals.
The Central Candlesticks scanner, specialised in Japanese candlesticks, did not identify any signals.
| S3 | S2 | S1 | Price | R1 | R2 | R3 | |
|---|---|---|---|---|---|---|---|
| ProTrendLines | 2,877.00 | 2,906.38 | 2,924.02 | 2,925.15 | 2,940.00 | 2,947.09 | 2,954.95 |
| Change (%) | -1.65% | -0.64% | -0.04% | - | +0.51% | +0.75% | +1.02% |
| Change | -48.15 | -18.77 | -1.13 | - | +14.85 | +21.94 | +29.80 |
| Level | Minor | Intermediate | Intermediate | - | Minor | Minor | Intermediate |
To determine price objectives, it is also possible to use the pivot points. Here is the price position in relation to pivot points:
| Pivot points | S3 | S2 | S1 | PP | R1 | R2 | R3 |
|---|---|---|---|---|---|---|---|
| Standard | 2,894.66 | 2,909.39 | 2,925.49 | 2,940.22 | 2,956.32 | 2,971.05 | 2,987.15 |
| Camarilla | 2,933.11 | 2,935.94 | 2,938.76 | 2,941.59 | 2,944.42 | 2,947.24 | 2,950.07 |
| Woodie | 2,895.35 | 2,909.73 | 2,926.18 | 2,940.56 | 2,957.01 | 2,971.39 | 2,987.84 |
| Fibonacci | 2,909.39 | 2,921.17 | 2,928.44 | 2,940.22 | 2,952.00 | 2,959.27 | 2,971.05 |
| Pivot points | S3 | S2 | S1 | PP | R1 | R2 | R3 |
|---|---|---|---|---|---|---|---|
| Standard | 2,756.75 | 2,805.78 | 2,844.70 | 2,893.73 | 2,932.65 | 2,981.68 | 3,020.60 |
| Camarilla | 2,859.42 | 2,867.49 | 2,875.55 | 2,883.61 | 2,891.67 | 2,899.73 | 2,907.80 |
| Woodie | 2,751.69 | 2,803.25 | 2,839.64 | 2,891.20 | 2,927.59 | 2,979.15 | 3,015.54 |
| Fibonacci | 2,805.78 | 2,839.38 | 2,860.14 | 2,893.73 | 2,927.33 | 2,948.09 | 2,981.68 |
| Pivot points | S3 | S2 | S1 | PP | R1 | R2 | R3 |
|---|---|---|---|---|---|---|---|
| Standard | 2,469.07 | 2,541.90 | 2,671.55 | 2,744.38 | 2,874.03 | 2,946.86 | 3,076.51 |
| Camarilla | 2,745.53 | 2,764.09 | 2,782.65 | 2,801.21 | 2,819.77 | 2,838.33 | 2,856.89 |
| Woodie | 2,497.49 | 2,556.11 | 2,699.97 | 2,758.59 | 2,902.45 | 2,961.07 | 3,104.93 |
| Fibonacci | 2,541.90 | 2,619.24 | 2,667.03 | 2,744.38 | 2,821.72 | 2,869.51 | 2,946.86 |
Numerical data
The following is the status of the technical indicators and moving averages at the time of publication of this technical analysis:
| RSI (14): | 47.39 | |
| MACD (12,26,9): | -1.6300 | |
| Directional Movement: | -7.34 | |
| AROON (14): | 7.14 | |
| DEMA (21): | 2,929.08 | |
| Parabolic SAR (0,02-0,02-0,2): | 2,924.62 | |
| Elder Ray (13): | 0.11 | |
| Super Trend (3,10): | 2,938.98 | |
| Zig ZAG (10): | 2,931.33 | |
| VORTEX (21): | 0.9000 | |
| Stochastique (14,3,5): | 72.54 | |
| TEMA (21): | 2,929.13 | |
| Williams %R (14): | -29.69 | |
| Chande Momentum Oscillator (20): | 0.90 | |
| Repulse (5,40,3): | 0.0100 | |
| ROCnROLL: | -1 | |
| TRIX (15,9): | -0.0100 | |
| Courbe Coppock: | 0.11 |
| MA7: | 2,922.39 | |
| MA20: | 2,864.27 | |
| MA50: | 2,744.59 | |
| MA100: | 2,707.58 | |
| MAexp7: | 2,930.57 | |
| MAexp20: | 2,931.54 | |
| MAexp50: | 2,934.81 | |
| MAexp100: | 2,936.97 | |
| Price / MA7: | +0.09% | |
| Price / MA20: | +2.13% | |
| Price / MA50: | +6.58% | |
| Price / MA100: | +8.04% | |
| Price / MAexp7: | -0.18% | |
| Price / MAexp20: | -0.22% | |
| Price / MAexp50: | -0.33% | |
| Price / MAexp100: | -0.40% |
News
Don't forget to follow the news on GOLD - USD. At the time of publication of this analysis, the latest news was as follows:
-
 XAU/USD Price Forecast Today, Technical Analysis (February 20): Gold Hits Record High Again
-
XAU/USD Price Forecast Today, Technical Analysis (February 20): Gold Pressures to the Upside
-
XAU/USD Price Forecast Today, Technical Analysis (February 19): Gold Hits New Record High
-
Gold Analysis: Can Gold Continue to Rise?
-
XAU/USD Price Forecast Today, Technical Analysis (February 19): Gold Continues to Look Bullish
About author

Online


Add a comment
Comments
0 comments on the analysis GOLD - USD - 15 min.