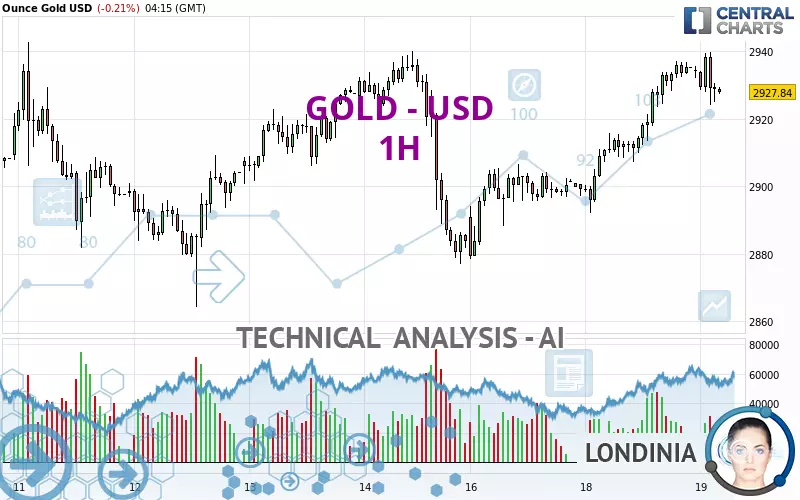
GOLD - USD - 1H - Technical analysis published on 02/19/2025 (GMT)
- 345
- 0
Click here for a new analysis!
- Timeframe : 1H
- - Analysis generated on
- Status : TARGET REACHED
Summary of the analysis

Additional analysis
Quotes
The GOLD - USD price is 2,927.84 USD. On the day, this instrument lost -0.21% with the lowest point at 2,924.17 USD and the highest point at 2,939.68 USD. The deviation from the price is +0.13% for the low point and -0.40% for the high point.The Central Gaps scanner detects a bearish opening marking the presence of sellers ahead of buyers at the opening but not sufficiently marked to allow the price to register a quotation gap.
Bearish opening
Type : Bearish
Timeframe : Openning
Here is a more detailed summary of the historical variations registered by GOLD - USD:
Near a new HIGH record (5 years)
Type : Bullish
Timeframe : Weekly
Near a new HIGH record (1 year)
Type : Bullish
Timeframe : Weekly
Near a new HIGH record (1st january)
Type : Bullish
Timeframe : Weekly
Near a new HIGH record (1 month)
Type : Bullish
Timeframe : Weekly
Technical
A technical analysis in 1H of this GOLD - USD chart shows a strongly bullish trend. The signals given by the moving averages are 89.29% bullish. This strong bullish trend is confirmed by the strong signals currently being given by short-term moving averages. An assessment of moving averages reveals a bearish signal that could impact this trend:
Bearish price crossover with Moving Average 20
Type : Bearish
Timeframe : 1 hour
The technical indicators are bullish. There is still some doubt about the price increase.
Central Indicators, the scanner specialised in technical indicators, has identified these signals:
Price is back over the pivot point
Type : Bullish
Timeframe : Weekly
Williams %R indicator is back under -50
Type : Bearish
Timeframe : 1 hour
The analysis of the price chart with Central Patterns scanners does not return any result.
The Central Candlesticks scanner which studies Japanese candlesticks did not detect anything.
| S3 | S2 | S1 | Price | R1 | |
|---|---|---|---|---|---|
| ProTrendLines | 2,892.01 | 2,906.65 | 2,923.01 | 2,927.84 | 2,942.77 |
| Change (%) | -1.22% | -0.72% | -0.16% | - | +0.51% |
| Change | -35.83 | -21.19 | -4.83 | - | +14.93 |
| Level | Minor | Major | Minor | - | Intermediate |
Pivot points can also be used to set your price objectives. Here is the price situation in relation to pivot points:
| Pivot points | S3 | S2 | S1 | PP | R1 | R2 | R3 |
|---|---|---|---|---|---|---|---|
| Standard | 2,860.02 | 2,876.01 | 2,905.04 | 2,921.03 | 2,950.06 | 2,966.05 | 2,995.08 |
| Camarilla | 2,921.68 | 2,925.81 | 2,929.93 | 2,934.06 | 2,938.19 | 2,942.31 | 2,946.44 |
| Woodie | 2,866.53 | 2,879.27 | 2,911.55 | 2,924.29 | 2,956.57 | 2,969.31 | 3,001.59 |
| Fibonacci | 2,876.01 | 2,893.21 | 2,903.84 | 2,921.03 | 2,938.23 | 2,948.86 | 2,966.05 |
| Pivot points | S3 | S2 | S1 | PP | R1 | R2 | R3 |
|---|---|---|---|---|---|---|---|
| Standard | 2,756.75 | 2,805.78 | 2,844.70 | 2,893.73 | 2,932.65 | 2,981.68 | 3,020.60 |
| Camarilla | 2,859.42 | 2,867.49 | 2,875.55 | 2,883.61 | 2,891.67 | 2,899.73 | 2,907.80 |
| Woodie | 2,751.69 | 2,803.25 | 2,839.64 | 2,891.20 | 2,927.59 | 2,979.15 | 3,015.54 |
| Fibonacci | 2,805.78 | 2,839.38 | 2,860.14 | 2,893.73 | 2,927.33 | 2,948.09 | 2,981.68 |
| Pivot points | S3 | S2 | S1 | PP | R1 | R2 | R3 |
|---|---|---|---|---|---|---|---|
| Standard | 2,469.07 | 2,541.90 | 2,671.55 | 2,744.38 | 2,874.03 | 2,946.86 | 3,076.51 |
| Camarilla | 2,745.53 | 2,764.09 | 2,782.65 | 2,801.21 | 2,819.77 | 2,838.33 | 2,856.89 |
| Woodie | 2,497.49 | 2,556.11 | 2,699.97 | 2,758.59 | 2,902.45 | 2,961.07 | 3,104.93 |
| Fibonacci | 2,541.90 | 2,619.24 | 2,667.03 | 2,744.38 | 2,821.72 | 2,869.51 | 2,946.86 |
Numerical data
The following is the status of technical indicators and moving averages registered at the time this technical analysis was created:
| RSI (14): | 64.02 | |
| MACD (12,26,9): | 7.2900 | |
| Directional Movement: | 10.98 | |
| AROON (14): | 100.00 | |
| DEMA (21): | 2,936.70 | |
| Parabolic SAR (0,02-0,02-0,2): | 2,928.07 | |
| Elder Ray (13): | 5.83 | |
| Super Trend (3,10): | 2,919.82 | |
| Zig ZAG (10): | 2,934.62 | |
| VORTEX (21): | 1.2000 | |
| Stochastique (14,3,5): | 82.23 | |
| TEMA (21): | 2,939.64 | |
| Williams %R (14): | -22.73 | |
| Chande Momentum Oscillator (20): | 5.68 | |
| Repulse (5,40,3): | -0.0200 | |
| ROCnROLL: | 1 | |
| TRIX (15,9): | 0.0400 | |
| Courbe Coppock: | 1.22 |
| MA7: | 2,912.34 | |
| MA20: | 2,846.85 | |
| MA50: | 2,735.43 | |
| MA100: | 2,702.04 | |
| MAexp7: | 2,933.68 | |
| MAexp20: | 2,927.07 | |
| MAexp50: | 2,917.58 | |
| MAexp100: | 2,911.03 | |
| Price / MA7: | +0.53% | |
| Price / MA20: | +2.84% | |
| Price / MA50: | +7.03% | |
| Price / MA100: | +8.36% | |
| Price / MAexp7: | -0.20% | |
| Price / MAexp20: | +0.03% | |
| Price / MAexp50: | +0.35% | |
| Price / MAexp100: | +0.58% |
News
The latest news and videos published on GOLD - USD at the time of the analysis were as follows:
-
 XAU/USD Price Forecast Today, Technical Analysis (February 18): Gold Shows Strength Again
-
XAU/USD Price Forecast Today, Technical Analysis (February 18): Gold Continues to Power Higher
-
XAU/USD Price Forecast Today, Technical Analysis (February 17): Gold Rallies a Bit on Monday
-
Azerbaijan Strikes Gold as Stars Shine in New Weight Categories
-
XAU/USD Price Forecast Today, Technical Analysis (February 14): Gold Faces Reversal
About author

Online


Add a comment
Comments
0 comments on the analysis GOLD - USD - 1H