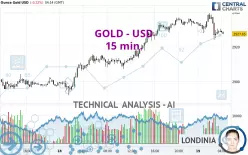
GOLD - USD - 15 min. - Technical analysis published on 02/19/2025 (GMT)
- 327
- 0
- Timeframe : 15 min.
- - Analysis generated on
- Status : NEUTRAL
Summary of the analysis

Additional analysis
Quotes
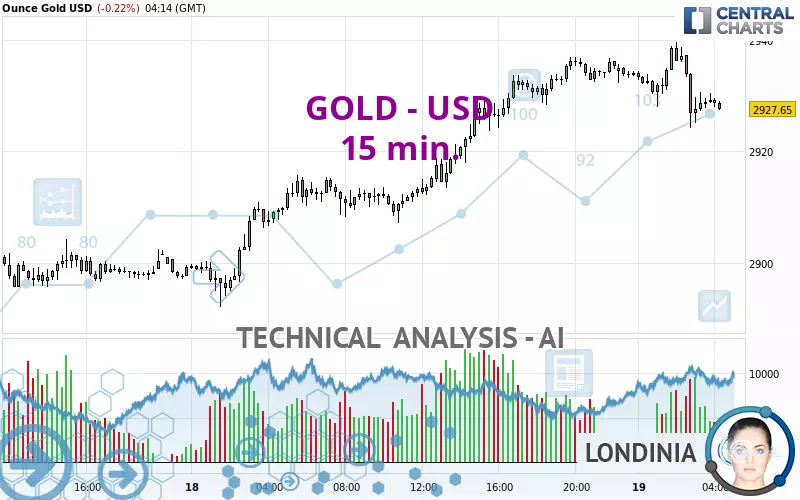
The GOLD - USD price is 2,927.73 USD. On the day, this instrument lost -0.22% with the lowest point at 2,924.17 USD and the highest point at 2,939.68 USD. The deviation from the price is +0.12% for the low point and -0.41% for the high point.The Central Gaps scanner detects a bearish opening. A small advantage for sellers in the very short term.
Bearish opening
Type : Bearish
Timeframe : Openning
So that you have an overall view of the price change, here is a table showing the variations over several periods:
Near a new HIGH record (5 years)
Type : Bullish
Timeframe : Weekly
Near a new HIGH record (1 year)
Type : Bullish
Timeframe : Weekly
Near a new HIGH record (1st january)
Type : Bullish
Timeframe : Weekly
Near a new HIGH record (1 month)
Type : Bullish
Timeframe : Weekly
Technical
Technical analysis of GOLD - USD in 15 min. shows an overall bullish trend. 64.29% of the signals given by moving averages are bullish. Caution: the strong bearish signals currently given by short-term moving averages indicate that this trend could quickly be called into question. A phase of indecision or a reversal of the trend could occur. The Central Indicators market scanner currently does not detect any result that concerns moving averages.
The technical indicators are generally neutral. They do not provide relevant information on the direction of future price movements.
Caution: the Central Indicators scanner currently detects an excess:
RSI indicator: bullish divergence
Type : Bullish
Timeframe : 15 minutes
Price is back over the pivot point
Type : Bullish
Timeframe : Weekly
Momentum indicator is back over 0
Type : Bullish
Timeframe : 15 minutes
The analysis of the price chart with Central Patterns scanners does not return any result.
The Central Candlesticks scanner, specialised in Japanese candlesticks, did not identify any signals.
| S3 | S2 | S1 | Price | R1 | |
|---|---|---|---|---|---|
| ProTrendLines | 2,892.01 | 2,906.65 | 2,923.01 | 2,927.73 | 2,942.77 |
| Change (%) | -1.22% | -0.72% | -0.16% | - | +0.51% |
| Change | -35.72 | -21.08 | -4.72 | - | +15.04 |
| Level | Minor | Major | Minor | - | Intermediate |
To determine price objectives, it is also possible to use the pivot points. Here is the price position in relation to pivot points:
| Pivot points | S3 | S2 | S1 | PP | R1 | R2 | R3 |
|---|---|---|---|---|---|---|---|
| Standard | 2,860.02 | 2,876.01 | 2,905.04 | 2,921.03 | 2,950.06 | 2,966.05 | 2,995.08 |
| Camarilla | 2,921.68 | 2,925.81 | 2,929.93 | 2,934.06 | 2,938.19 | 2,942.31 | 2,946.44 |
| Woodie | 2,866.53 | 2,879.27 | 2,911.55 | 2,924.29 | 2,956.57 | 2,969.31 | 3,001.59 |
| Fibonacci | 2,876.01 | 2,893.21 | 2,903.84 | 2,921.03 | 2,938.23 | 2,948.86 | 2,966.05 |
| Pivot points | S3 | S2 | S1 | PP | R1 | R2 | R3 |
|---|---|---|---|---|---|---|---|
| Standard | 2,756.75 | 2,805.78 | 2,844.70 | 2,893.73 | 2,932.65 | 2,981.68 | 3,020.60 |
| Camarilla | 2,859.42 | 2,867.49 | 2,875.55 | 2,883.61 | 2,891.67 | 2,899.73 | 2,907.80 |
| Woodie | 2,751.69 | 2,803.25 | 2,839.64 | 2,891.20 | 2,927.59 | 2,979.15 | 3,015.54 |
| Fibonacci | 2,805.78 | 2,839.38 | 2,860.14 | 2,893.73 | 2,927.33 | 2,948.09 | 2,981.68 |
| Pivot points | S3 | S2 | S1 | PP | R1 | R2 | R3 |
|---|---|---|---|---|---|---|---|
| Standard | 2,469.07 | 2,541.90 | 2,671.55 | 2,744.38 | 2,874.03 | 2,946.86 | 3,076.51 |
| Camarilla | 2,745.53 | 2,764.09 | 2,782.65 | 2,801.21 | 2,819.77 | 2,838.33 | 2,856.89 |
| Woodie | 2,497.49 | 2,556.11 | 2,699.97 | 2,758.59 | 2,902.45 | 2,961.07 | 3,104.93 |
| Fibonacci | 2,541.90 | 2,619.24 | 2,667.03 | 2,744.38 | 2,821.72 | 2,869.51 | 2,946.86 |
Numerical data
The following is the status of the technical indicators and moving averages at the time of publication of this technical analysis:
| RSI (14): | 44.66 | |
| MACD (12,26,9): | -0.3900 | |
| Directional Movement: | -13.28 | |
| AROON (14): | -21.43 | |
| DEMA (21): | 2,931.86 | |
| Parabolic SAR (0,02-0,02-0,2): | 2,938.48 | |
| Elder Ray (13): | -1.75 | |
| Super Trend (3,10): | 2,937.99 | |
| Zig ZAG (10): | 2,929.75 | |
| VORTEX (21): | 0.9200 | |
| Stochastique (14,3,5): | 33.21 | |
| TEMA (21): | 2,929.73 | |
| Williams %R (14): | -66.92 | |
| Chande Momentum Oscillator (20): | 0.13 | |
| Repulse (5,40,3): | -0.0100 | |
| ROCnROLL: | -1 | |
| TRIX (15,9): | 0.0000 | |
| Courbe Coppock: | 0.17 |
| MA7: | 2,912.34 | |
| MA20: | 2,846.85 | |
| MA50: | 2,735.43 | |
| MA100: | 2,702.04 | |
| MAexp7: | 2,930.45 | |
| MAexp20: | 2,932.34 | |
| MAexp50: | 2,929.82 | |
| MAexp100: | 2,923.61 | |
| Price / MA7: | +0.53% | |
| Price / MA20: | +2.84% | |
| Price / MA50: | +7.03% | |
| Price / MA100: | +8.35% | |
| Price / MAexp7: | -0.10% | |
| Price / MAexp20: | -0.16% | |
| Price / MAexp50: | -0.07% | |
| Price / MAexp100: | +0.14% |
News
The last news published on GOLD - USD at the time of the generation of this analysis was as follows:
-
 XAU/USD Price Forecast Today, Technical Analysis (February 18): Gold Shows Strength Again
-
XAU/USD Price Forecast Today, Technical Analysis (February 18): Gold Continues to Power Higher
-
XAU/USD Price Forecast Today, Technical Analysis (February 17): Gold Rallies a Bit on Monday
-
Azerbaijan Strikes Gold as Stars Shine in New Weight Categories
-
XAU/USD Price Forecast Today, Technical Analysis (February 14): Gold Faces Reversal
About author

Online


Add a comment
Comments
0 comments on the analysis GOLD - USD - 15 min.