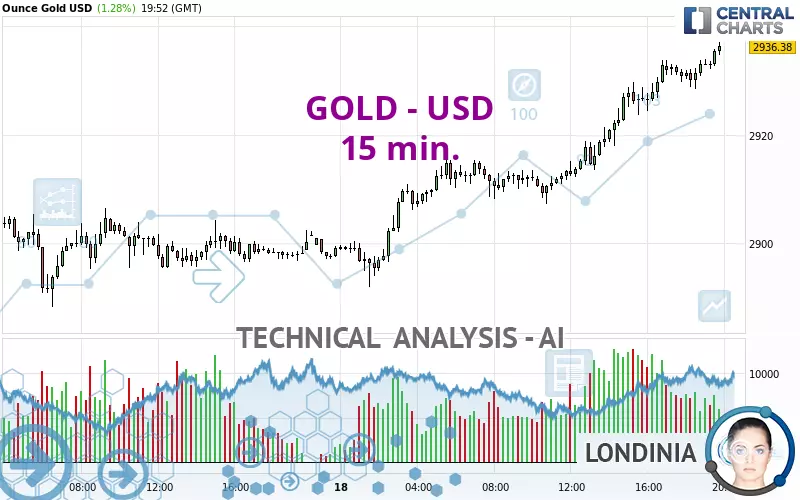
GOLD - USD - 15 min. - Technical analysis published on 02/18/2025 (GMT)
- 201
- 0
Click here for a new analysis!
- Timeframe : 15 min.
- - Analysis generated on
- Status : LEVEL MAINTAINED

Summary of the analysis

Additional analysis
Quotes
The GOLD - USD price is 2,936.38 USD. The price registered an increase of +1.28% on the session and was between 2,892.01 USD and 2,937.03 USD. This implies that the price is at +1.53% from its lowest and at -0.02% from its highest.The Central Gaps scanner detects a bullish opening. A small advantage for buyers in the very short term.
Bullish opening
Type : Bullish
Timeframe : Openning
Here is a more detailed summary of the historical variations registered by GOLD - USD:
Near a new HIGH record (5 years)
Type : Bullish
Timeframe : Weekly
Near a new HIGH record (1 year)
Type : Bullish
Timeframe : Weekly
Near a new HIGH record (1st january)
Type : Bullish
Timeframe : Weekly
Near a new HIGH record (1 month)
Type : Bullish
Timeframe : Weekly
Technical
A technical analysis in 15 min. of this GOLD - USD chart shows a strongly bullish trend. The signals given by the moving averages are 92.86% bullish. This strong bullish trend is confirmed by the strong signals currently being given by short-term moving averages. There is no crossing of moving average by the price or crossing of moving averages between themselves.
In fact, according to the parameters integrated into the Central Analyzer system, 14 technical indicators out of 18 analysed are currently bullish. Caution: the Central Indicators scanner currently detects an excess:
RSI indicator is overbought : over 70
Type : Neutral
Timeframe : 15 minutes
CCI indicator is overbought : over 100
Type : Neutral
Timeframe : 15 minutes
Williams %R indicator is overbought : over -20
Type : Neutral
Timeframe : 15 minutes
Pivot points : price is over resistance 1
Type : Neutral
Timeframe : Weekly
Pivot points : price is over resistance 2
Type : Neutral
Timeframe : 15 minutes
The analysis of the price chart with Central Patterns scanners does not return any result.
Central Candlesticks, the scanner specialised in Japanese candlesticks, detects this inversion signal that could impact the current short-term trend:
Doji
Type : Neutral
Timeframe : 15 minutes
| S3 | S2 | S1 | Price | R1 | |
|---|---|---|---|---|---|
| ProTrendLines | 2,906.24 | 2,923.01 | 2,933.94 | 2,936.38 | 2,942.77 |
| Change (%) | -1.03% | -0.46% | -0.08% | - | +0.22% |
| Change | -30.14 | -13.37 | -2.44 | - | +6.39 |
| Level | Major | Minor | Minor | - | Intermediate |
To determine price objectives, it is also possible to use the pivot points. Here is the price position in relation to pivot points:
| Pivot points | S3 | S2 | S1 | PP | R1 | R2 | R3 |
|---|---|---|---|---|---|---|---|
| Standard | 2,855.02 | 2,866.78 | 2,883.00 | 2,894.76 | 2,910.98 | 2,922.74 | 2,938.96 |
| Camarilla | 2,891.54 | 2,894.10 | 2,896.67 | 2,899.23 | 2,901.80 | 2,904.36 | 2,906.93 |
| Woodie | 2,857.26 | 2,867.90 | 2,885.24 | 2,895.88 | 2,913.22 | 2,923.86 | 2,941.20 |
| Fibonacci | 2,866.78 | 2,877.47 | 2,884.07 | 2,894.76 | 2,905.45 | 2,912.05 | 2,922.74 |
| Pivot points | S3 | S2 | S1 | PP | R1 | R2 | R3 |
|---|---|---|---|---|---|---|---|
| Standard | 2,756.75 | 2,805.78 | 2,844.70 | 2,893.73 | 2,932.65 | 2,981.68 | 3,020.60 |
| Camarilla | 2,859.42 | 2,867.49 | 2,875.55 | 2,883.61 | 2,891.67 | 2,899.73 | 2,907.80 |
| Woodie | 2,751.69 | 2,803.25 | 2,839.64 | 2,891.20 | 2,927.59 | 2,979.15 | 3,015.54 |
| Fibonacci | 2,805.78 | 2,839.38 | 2,860.14 | 2,893.73 | 2,927.33 | 2,948.09 | 2,981.68 |
| Pivot points | S3 | S2 | S1 | PP | R1 | R2 | R3 |
|---|---|---|---|---|---|---|---|
| Standard | 2,469.07 | 2,541.90 | 2,671.55 | 2,744.38 | 2,874.03 | 2,946.86 | 3,076.51 |
| Camarilla | 2,745.53 | 2,764.09 | 2,782.65 | 2,801.21 | 2,819.77 | 2,838.33 | 2,856.89 |
| Woodie | 2,497.49 | 2,556.11 | 2,699.97 | 2,758.59 | 2,902.45 | 2,961.07 | 3,104.93 |
| Fibonacci | 2,541.90 | 2,619.24 | 2,667.03 | 2,744.38 | 2,821.72 | 2,869.51 | 2,946.86 |
Numerical data
The following are the details of the technical indicators and moving averages that were collected to generate this technical analysis:
| RSI (14): | 72.15 | |
| MACD (12,26,9): | 3.7000 | |
| Directional Movement: | 15.35 | |
| AROON (14): | 100.00 | |
| DEMA (21): | 2,934.69 | |
| Parabolic SAR (0,02-0,02-0,2): | 2,928.90 | |
| Elder Ray (13): | 2.99 | |
| Super Trend (3,10): | 2,926.43 | |
| Zig ZAG (10): | 2,934.93 | |
| VORTEX (21): | 1.2400 | |
| Stochastique (14,3,5): | 89.92 | |
| TEMA (21): | 2,934.95 | |
| Williams %R (14): | -3.21 | |
| Chande Momentum Oscillator (20): | 4.39 | |
| Repulse (5,40,3): | 0.0900 | |
| ROCnROLL: | 1 | |
| TRIX (15,9): | 0.0200 | |
| Courbe Coppock: | 0.33 |
| MA7: | 2,910.30 | |
| MA20: | 2,837.92 | |
| MA50: | 2,729.95 | |
| MA100: | 2,699.06 | |
| MAexp7: | 2,933.57 | |
| MAexp20: | 2,929.58 | |
| MAexp50: | 2,922.53 | |
| MAexp100: | 2,916.16 | |
| Price / MA7: | +0.90% | |
| Price / MA20: | +3.47% | |
| Price / MA50: | +7.56% | |
| Price / MA100: | +8.79% | |
| Price / MAexp7: | +0.10% | |
| Price / MAexp20: | +0.23% | |
| Price / MAexp50: | +0.47% | |
| Price / MAexp100: | +0.69% |
News
Don't forget to follow the news on GOLD - USD. At the time of publication of this analysis, the latest news was as follows:
-
 XAU/USD Price Forecast Today, Technical Analysis (February 18): Gold Continues to Power Higher
-
XAU/USD Price Forecast Today, Technical Analysis (February 17): Gold Rallies a Bit on Monday
-
Azerbaijan Strikes Gold as Stars Shine in New Weight Categories
-
XAU/USD Price Forecast Today, Technical Analysis (February 14): Gold Faces Reversal
-
XAU/USD Price Forecast Today, Technical Analysis (February 13): Gold Continues to Grind Higher
About author

Online


Add a comment
Comments
0 comments on the analysis GOLD - USD - 15 min.