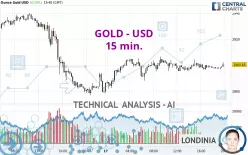
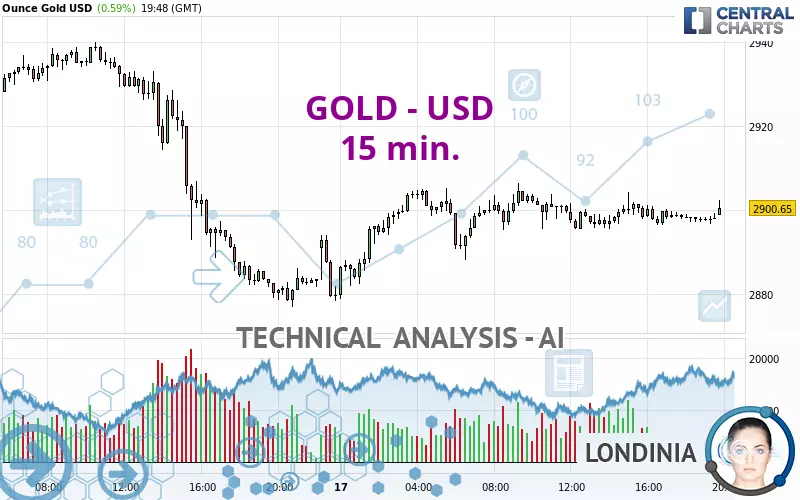
GOLD - USD - 15 min. - Technical analysis published on 02/17/2025 (GMT)
- 81
- 0
Click here for a new analysis!
- Timeframe : 15 min.
- - Analysis generated on
- Status : LEVEL MAINTAINED
Summary of the analysis

Additional analysis
Quotes
GOLD - USD rating 2,900.65 USD. The price registered an increase of +0.59% on the session and was between 2,878.53 USD and 2,906.51 USD. This implies that the price is at +0.77% from its lowest and at -0.20% from its highest.A bullish opening was detected by the Central Gaps scanner. Buyers are trying to impose a bullish momentum in the very short term.
Bullish opening
Type : Bullish
Timeframe : Openning
A study of price movements over other periods shows the following variations:
Near a new HIGH record (5 years)
Type : Bullish
Timeframe : Weekly
Near a new HIGH record (1 year)
Type : Bullish
Timeframe : Weekly
Near a new HIGH record (1st january)
Type : Bullish
Timeframe : Weekly
Near a new HIGH record (1 month)
Type : Bullish
Timeframe : Weekly
Technical
A technical analysis in 15 min. of this GOLD - USD chart shows a slightly bullish trend. Only 57.14% of the signals given by moving averages are bullish. This slightly bullish trend is not supported by the signals currently being given by short-term moving averages. An assessment of moving averages reveals several bearish and bullish signals:
Bullish trend reversal : adaptative moving average 20
Type : Bullish
Timeframe : 15 minutes
Bullish trend reversal : adaptative moving average 50
Type : Bullish
Timeframe : 15 minutes
Bearish price crossover with adaptative moving average 100
Type : Bearish
Timeframe : 15 minutes
An assessment of technical indicators shows a slightly bullish signal.
Central Indicators, the scanner specialised in technical indicators, has identified these signals:
MACD crosses UP its Moving Average
Type : Bullish
Timeframe : 15 minutes
Price is back over the pivot point
Type : Bullish
Timeframe : Weekly
No signals are given by Central Patterns, a market scanner specialised in chart patterns, resistances and supports.
No result was found by the Central Candlesticks scanner on Japanese candlesticks.
| S3 | S2 | S1 | Price | R1 | R2 | R3 | |
|---|---|---|---|---|---|---|---|
| ProTrendLines | 2,852.77 | 2,864.12 | 2,882.20 | 2,900.65 | 2,909.16 | 2,923.16 | 2,942.77 |
| Change (%) | -1.65% | -1.26% | -0.64% | - | +0.29% | +0.78% | +1.45% |
| Change | -47.88 | -36.53 | -18.45 | - | +8.51 | +22.51 | +42.12 |
| Level | Minor | Intermediate | Intermediate | - | Minor | Intermediate | Minor |
To determine price objectives, it is also possible to use the pivot points. Here is the price position in relation to pivot points:
| Pivot points | S3 | S2 | S1 | PP | R1 | R2 | R3 |
|---|---|---|---|---|---|---|---|
| Standard | 2,797.35 | 2,837.18 | 2,860.39 | 2,900.22 | 2,923.43 | 2,963.26 | 2,986.47 |
| Camarilla | 2,866.27 | 2,872.05 | 2,877.83 | 2,883.61 | 2,889.39 | 2,895.17 | 2,900.95 |
| Woodie | 2,789.05 | 2,833.03 | 2,852.09 | 2,896.07 | 2,915.13 | 2,959.11 | 2,978.17 |
| Fibonacci | 2,837.18 | 2,861.26 | 2,876.14 | 2,900.22 | 2,924.30 | 2,939.18 | 2,963.26 |
| Pivot points | S3 | S2 | S1 | PP | R1 | R2 | R3 |
|---|---|---|---|---|---|---|---|
| Standard | 2,756.75 | 2,805.78 | 2,844.70 | 2,893.73 | 2,932.65 | 2,981.68 | 3,020.60 |
| Camarilla | 2,859.42 | 2,867.49 | 2,875.55 | 2,883.61 | 2,891.67 | 2,899.73 | 2,907.80 |
| Woodie | 2,751.69 | 2,803.25 | 2,839.64 | 2,891.20 | 2,927.59 | 2,979.15 | 3,015.54 |
| Fibonacci | 2,805.78 | 2,839.38 | 2,860.14 | 2,893.73 | 2,927.33 | 2,948.09 | 2,981.68 |
| Pivot points | S3 | S2 | S1 | PP | R1 | R2 | R3 |
|---|---|---|---|---|---|---|---|
| Standard | 2,469.07 | 2,541.90 | 2,671.55 | 2,744.38 | 2,874.03 | 2,946.86 | 3,076.51 |
| Camarilla | 2,745.53 | 2,764.09 | 2,782.65 | 2,801.21 | 2,819.77 | 2,838.33 | 2,856.89 |
| Woodie | 2,497.49 | 2,556.11 | 2,699.97 | 2,758.59 | 2,902.45 | 2,961.07 | 3,104.93 |
| Fibonacci | 2,541.90 | 2,619.24 | 2,667.03 | 2,744.38 | 2,821.72 | 2,869.51 | 2,946.86 |
Numerical data
The following is the status of technical indicators and moving averages registered at the time this technical analysis was created:
| RSI (14): | 51.14 | |
| MACD (12,26,9): | -0.1700 | |
| Directional Movement: | 3.51 | |
| AROON (14): | -21.43 | |
| DEMA (21): | 2,898.43 | |
| Parabolic SAR (0,02-0,02-0,2): | 2,901.37 | |
| Elder Ray (13): | 0.68 | |
| Super Trend (3,10): | 2,903.73 | |
| Zig ZAG (10): | 2,899.02 | |
| VORTEX (21): | 1.0300 | |
| Stochastique (14,3,5): | 44.95 | |
| TEMA (21): | 2,898.24 | |
| Williams %R (14): | -43.05 | |
| Chande Momentum Oscillator (20): | 2.12 | |
| Repulse (5,40,3): | 0.0400 | |
| ROCnROLL: | 1 | |
| TRIX (15,9): | 0.0000 | |
| Courbe Coppock: | 0.08 |
| MA7: | 2,899.68 | |
| MA20: | 2,828.37 | |
| MA50: | 2,723.95 | |
| MA100: | 2,696.29 | |
| MAexp7: | 2,898.63 | |
| MAexp20: | 2,898.65 | |
| MAexp50: | 2,898.81 | |
| MAexp100: | 2,900.61 | |
| Price / MA7: | +0.03% | |
| Price / MA20: | +2.56% | |
| Price / MA50: | +6.49% | |
| Price / MA100: | +7.58% | |
| Price / MAexp7: | +0.07% | |
| Price / MAexp20: | +0.07% | |
| Price / MAexp50: | +0.06% | |
| Price / MAexp100: | +0.00% |
News
The last news published on GOLD - USD at the time of the generation of this analysis was as follows:
-
 XAU/USD Price Forecast Today, Technical Analysis (February 17): Gold Rallies a Bit on Monday
-
Azerbaijan Strikes Gold as Stars Shine in New Weight Categories
-
XAU/USD Price Forecast Today, Technical Analysis (February 14): Gold Faces Reversal
-
XAU/USD Price Forecast Today, Technical Analysis (February 13): Gold Continues to Grind Higher
-
Technical Outlook on EURUSD, USDCHF, Gold
About author

Online


Add a comment
Comments
0 comments on the analysis GOLD - USD - 15 min.