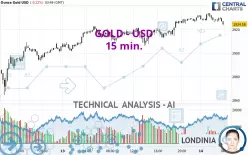
GOLD - USD - 15 min. - Technical analysis published on 02/14/2025 (GMT)
- 240
- 0
- Timeframe : 15 min.
- - Analysis generated on
- Status : NEUTRAL

Summary of the analysis

Additional analysis
Quotes
GOLD - USD rating 2,924.60 USD. The price registered a decrease of -0.22% on the session with the lowest point at 2,923.46 USD and the highest point at 2,933.94 USD. The deviation from the price is +0.04% for the low point and -0.32% for the high point.The Central Gaps scanner detects a bullish opening. A small advantage for buyers in the very short term.
Bullish opening
Type : Bullish
Timeframe : Openning
A study of price movements over other periods shows the following variations:
New HIGH record (5 years)
Type : Bullish
Timeframe : Weekly
Near a new HIGH record (1 year)
Type : Bullish
Timeframe : Weekly
Near a new HIGH record (1st january)
Type : Bullish
Timeframe : Weekly
Near a new HIGH record (1 month)
Type : Bullish
Timeframe : Weekly
Technical
Technical analysis of GOLD - USD in 15 min. shows an overall slightly bullish trend. 60.71% of the signals given by moving averages are bullish. Caution: the slightly bearish signals currently given by short-term moving averages indicate that this slightly bullish trend could be reversed. The Central Indicators market scanner is currently detecting several bearish signals that could impact this trend:
Bearish price crossover with Moving Average 50
Type : Bearish
Timeframe : 15 minutes
Bearish price crossover with adaptative moving average 20
Type : Bearish
Timeframe : 15 minutes
An assessment of technical indicators does not currently provide any relevant information on the direction of future price movements.
Caution: the Central Indicators scanner currently detects an excess:
CCI indicator is oversold : under -100
Type : Neutral
Timeframe : 15 minutes
Williams %R indicator is oversold : under -80
Type : Neutral
Timeframe : 15 minutes
Pivot points : price is over resistance 1
Type : Neutral
Timeframe : Weekly
RSI indicator is back under 50
Type : Bearish
Timeframe : 15 minutes
Ichimoku - Bearish crossover : Tenkan & Kijun
Type : Bearish
Timeframe : 15 minutes
Momentum indicator is back under 0
Type : Bearish
Timeframe : 15 minutes
Central Patterns, the scanner specializing in chart patterns, did not identify any signals.
From the Japanese candlestick perspective, the Central Candlesticks scanner notes the presence of these results that could impact the short-term trend:
Bullish harami
Type : Bullish
Timeframe : 15 minutes
Black evening star
Type : Bearish
Timeframe : 15 minutes
| S3 | S2 | S1 | Price | R1 | |
|---|---|---|---|---|---|
| ProTrendLines | 2,834.23 | 2,882.20 | 2,922.58 | 2,924.60 | 2,942.77 |
| Change (%) | -3.09% | -1.45% | -0.07% | - | +0.62% |
| Change | -90.37 | -42.40 | -2.02 | - | +18.17 |
| Level | Minor | Intermediate | Intermediate | - | Intermediate |
Attention could also be paid to pivot points to set price objectives:
| Pivot points | S3 | S2 | S1 | PP | R1 | R2 | R3 |
|---|---|---|---|---|---|---|---|
| Standard | 2,880.09 | 2,890.79 | 2,910.98 | 2,921.68 | 2,941.87 | 2,952.57 | 2,972.76 |
| Camarilla | 2,922.68 | 2,925.51 | 2,928.34 | 2,931.17 | 2,934.00 | 2,936.83 | 2,939.67 |
| Woodie | 2,884.84 | 2,893.16 | 2,915.73 | 2,924.05 | 2,946.62 | 2,954.94 | 2,977.51 |
| Fibonacci | 2,890.79 | 2,902.59 | 2,909.88 | 2,921.68 | 2,933.48 | 2,940.77 | 2,952.57 |
| Pivot points | S3 | S2 | S1 | PP | R1 | R2 | R3 |
|---|---|---|---|---|---|---|---|
| Standard | 2,678.71 | 2,725.47 | 2,793.27 | 2,840.03 | 2,907.83 | 2,954.59 | 3,022.39 |
| Camarilla | 2,829.56 | 2,840.06 | 2,850.56 | 2,861.06 | 2,871.56 | 2,882.06 | 2,892.56 |
| Woodie | 2,689.22 | 2,730.73 | 2,803.78 | 2,845.29 | 2,918.34 | 2,959.85 | 3,032.90 |
| Fibonacci | 2,725.47 | 2,769.24 | 2,796.27 | 2,840.03 | 2,883.80 | 2,910.83 | 2,954.59 |
| Pivot points | S3 | S2 | S1 | PP | R1 | R2 | R3 |
|---|---|---|---|---|---|---|---|
| Standard | 2,469.07 | 2,541.90 | 2,671.55 | 2,744.38 | 2,874.03 | 2,946.86 | 3,076.51 |
| Camarilla | 2,745.53 | 2,764.09 | 2,782.65 | 2,801.21 | 2,819.77 | 2,838.33 | 2,856.89 |
| Woodie | 2,497.49 | 2,556.11 | 2,699.97 | 2,758.59 | 2,902.45 | 2,961.07 | 3,104.93 |
| Fibonacci | 2,541.90 | 2,619.24 | 2,667.03 | 2,744.38 | 2,821.72 | 2,869.51 | 2,946.86 |
Numerical data
The following are the details of the technical indicators and moving averages that were collected to generate this technical analysis:
| RSI (14): | 39.17 | |
| MACD (12,26,9): | 0.5500 | |
| Directional Movement: | -6.63 | |
| AROON (14): | -64.29 | |
| DEMA (21): | 2,929.12 | |
| Parabolic SAR (0,02-0,02-0,2): | 2,932.35 | |
| Elder Ray (13): | -1.73 | |
| Super Trend (3,10): | 2,935.07 | |
| Zig ZAG (10): | 2,924.27 | |
| VORTEX (21): | 0.9100 | |
| Stochastique (14,3,5): | 28.96 | |
| TEMA (21): | 2,927.79 | |
| Williams %R (14): | -91.32 | |
| Chande Momentum Oscillator (20): | -3.97 | |
| Repulse (5,40,3): | -0.2000 | |
| ROCnROLL: | -1 | |
| TRIX (15,9): | 0.0100 | |
| Courbe Coppock: | 0.10 |
| MA7: | 2,899.56 | |
| MA20: | 2,820.96 | |
| MA50: | 2,719.45 | |
| MA100: | 2,694.43 | |
| MAexp7: | 2,926.70 | |
| MAexp20: | 2,927.86 | |
| MAexp50: | 2,924.78 | |
| MAexp100: | 2,919.47 | |
| Price / MA7: | +0.86% | |
| Price / MA20: | +3.67% | |
| Price / MA50: | +7.54% | |
| Price / MA100: | +8.54% | |
| Price / MAexp7: | -0.07% | |
| Price / MAexp20: | -0.11% | |
| Price / MAexp50: | -0.01% | |
| Price / MAexp100: | +0.18% |
News
Don't forget to follow the news on GOLD - USD. At the time of publication of this analysis, the latest news was as follows:
-
 XAU/USD Price Forecast Today, Technical Analysis (February 13): Gold Continues to Grind Higher
-
Technical Outlook on EURUSD, USDCHF, Gold
-
XAU/USD Price Forecast Today, Technical Analysis (February 12): Gold Buyers Defend Support
-
XAU/USD Price Forecast Today, Technical Analysis (February 11): Gold Hits New Record High Again
-
XAU/USD Price Forecast Today, Technical Analysis (February 11): Gold Has a Wild Night in Asia
About author

Online


Add a comment
Comments
0 comments on the analysis GOLD - USD - 15 min.