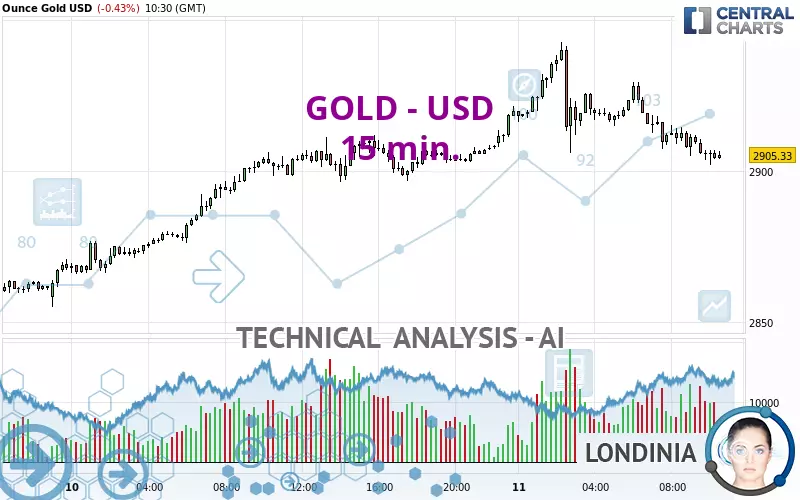
GOLD - USD - 15 min. - Technical analysis published on 02/11/2025 (GMT)
- 104
- 0
Click here for a new analysis!
- Timeframe : 15 min.
- - Analysis generated on
- Status : TARGET REACHED

Summary of the analysis

Additional analysis
Quotes
The GOLD - USD price is 2,905.31 USD. On the day, this instrument lost -0.43% and was between 2,901.89 USD and 2,942.77 USD. This implies that the price is at +0.12% from its lowest and at -1.27% from its highest.The Central Gaps scanner detects a bullish opening. A small advantage for buyers in the very short term.
Bullish opening
Type : Bullish
Timeframe : Openning
Here is a more detailed summary of the historical variations registered by GOLD - USD:
New HIGH record (5 years)
Type : Bullish
Timeframe : Weekly
New HIGH record (1 year)
Type : Bullish
Timeframe : Weekly
New HIGH record (1st january)
Type : Bullish
Timeframe : Weekly
New HIGH record (1 month)
Type : Bullish
Timeframe : Weekly
Technical
A technical analysis in 15 min. of this GOLD - USD chart shows a bearish trend. 67.86% of the signals given by moving averages are bearish. This bearish trend is supported by the strong bearish signals given by short-term moving averages. An assessment of moving averages reveals a bearish signal that could impact this trend:
Bearish trend reversal : Moving Average 50
Type : Bearish
Timeframe : 15 minutes
In fact, 12 technical indicators on 18 studied are currently positioned bearish. But beware of excesses. The Central Indicators scanner currently detects this:
CCI indicator is oversold : under -100
Type : Neutral
Timeframe : 15 minutes
Williams %R indicator is oversold : under -80
Type : Neutral
Timeframe : 15 minutes
No signals are given by Central Patterns, a market scanner specialised in chart patterns, resistances and supports.
Central Candlesticks, the scanner specialised in Japanese candlesticks, detects a bearish signal that could support the hypothesis of a small drop in the very short term:
Bearish harami
Type : Bearish
Timeframe : 15 minutes
| S3 | S2 | S1 | Price | R1 | |
|---|---|---|---|---|---|
| ProTrendLines | 2,785.43 | 2,807.22 | 2,852.70 | 2,905.31 | 2,911.82 |
| Change (%) | -4.13% | -3.38% | -1.81% | - | +0.22% |
| Change | -119.88 | -98.09 | -52.61 | - | +6.51 |
| Level | Minor | Minor | Intermediate | - | Intermediate |
Attention could also be paid to pivot points to set price objectives:
| Pivot points | S3 | S2 | S1 | PP | R1 | R2 | R3 |
|---|---|---|---|---|---|---|---|
| Standard | 2,807.79 | 2,831.31 | 2,874.59 | 2,898.11 | 2,941.39 | 2,964.91 | 3,008.19 |
| Camarilla | 2,899.51 | 2,905.63 | 2,911.76 | 2,917.88 | 2,924.00 | 2,930.13 | 2,936.25 |
| Woodie | 2,817.68 | 2,836.25 | 2,884.48 | 2,903.05 | 2,951.28 | 2,969.85 | 3,018.08 |
| Fibonacci | 2,831.31 | 2,856.82 | 2,872.59 | 2,898.11 | 2,923.62 | 2,939.39 | 2,964.91 |
| Pivot points | S3 | S2 | S1 | PP | R1 | R2 | R3 |
|---|---|---|---|---|---|---|---|
| Standard | 2,678.71 | 2,725.47 | 2,793.27 | 2,840.03 | 2,907.83 | 2,954.59 | 3,022.39 |
| Camarilla | 2,829.56 | 2,840.06 | 2,850.56 | 2,861.06 | 2,871.56 | 2,882.06 | 2,892.56 |
| Woodie | 2,689.22 | 2,730.73 | 2,803.78 | 2,845.29 | 2,918.34 | 2,959.85 | 3,032.90 |
| Fibonacci | 2,725.47 | 2,769.24 | 2,796.27 | 2,840.03 | 2,883.80 | 2,910.83 | 2,954.59 |
| Pivot points | S3 | S2 | S1 | PP | R1 | R2 | R3 |
|---|---|---|---|---|---|---|---|
| Standard | 2,469.07 | 2,541.90 | 2,671.55 | 2,744.38 | 2,874.03 | 2,946.86 | 3,076.51 |
| Camarilla | 2,745.53 | 2,764.09 | 2,782.65 | 2,801.21 | 2,819.77 | 2,838.33 | 2,856.89 |
| Woodie | 2,497.49 | 2,556.11 | 2,699.97 | 2,758.59 | 2,902.45 | 2,961.07 | 3,104.93 |
| Fibonacci | 2,541.90 | 2,619.24 | 2,667.03 | 2,744.38 | 2,821.72 | 2,869.51 | 2,946.86 |
Numerical data
The following are the details of the technical indicators and moving averages that were collected to generate this technical analysis:
| RSI (14): | 39.70 | |
| MACD (12,26,9): | -3.6600 | |
| Directional Movement: | -18.63 | |
| AROON (14): | -92.86 | |
| DEMA (21): | 2,907.97 | |
| Parabolic SAR (0,02-0,02-0,2): | 2,923.25 | |
| Elder Ray (13): | -5.59 | |
| Super Trend (3,10): | 2,919.99 | |
| Zig ZAG (10): | 2,906.41 | |
| VORTEX (21): | 0.8700 | |
| Stochastique (14,3,5): | 8.41 | |
| TEMA (21): | 2,904.39 | |
| Williams %R (14): | -77.85 | |
| Chande Momentum Oscillator (20): | -5.57 | |
| Repulse (5,40,3): | -0.0700 | |
| ROCnROLL: | 2 | |
| TRIX (15,9): | -0.0100 | |
| Courbe Coppock: | 0.83 |
| MA7: | 2,866.55 | |
| MA20: | 2,788.59 | |
| MA50: | 2,703.04 | |
| MA100: | 2,686.28 | |
| MAexp7: | 2,906.60 | |
| MAexp20: | 2,911.91 | |
| MAexp50: | 2,913.64 | |
| MAexp100: | 2,907.65 | |
| Price / MA7: | +1.35% | |
| Price / MA20: | +4.19% | |
| Price / MA50: | +7.48% | |
| Price / MA100: | +8.15% | |
| Price / MAexp7: | -0.05% | |
| Price / MAexp20: | -0.23% | |
| Price / MAexp50: | -0.29% | |
| Price / MAexp100: | -0.08% |
News
The last news published on GOLD - USD at the time of the generation of this analysis was as follows:
-
 XAU/USD Price Forecast Today, Technical Analysis (February 10): Gold Continues to Break Even Higher
-
XAU/USD Price Forecast Today, Technical Analysis (February 07): Gold Hits New Record but Reverses
-
XAU/USD Price Forecast Today, Technical Analysis (February 07): Gold Rallies Again for the Week
-
XAU/USD Price Forecast Today, Technical Analysis (February 06): Gold Retreats After Record High
-
Gold (XAU/USD) Daily Price Forecast and Technical Analysis, February 6, 2025, #trading #gold #xau
About author

Online


Add a comment
Comments
0 comments on the analysis GOLD - USD - 15 min.