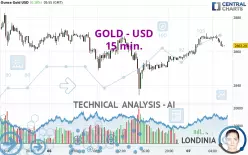
GOLD - USD - 15 min. - Technical analysis published on 02/07/2025 (GMT)
- 116
- 0
- Timeframe : 15 min.
- - Analysis generated on
- Status : NEUTRAL

Summary of the analysis

Additional analysis
Quotes
The GOLD - USD rating is 2,863.16 USD. On the day, this instrument gained +0.18% and was traded between 2,857.90 USD and 2,870.61 USD over the period. The price is currently at +0.18% from its lowest and -0.26% from its highest.A bullish opening was detected by the Central Gaps scanner. Buyers are trying to impose a bullish momentum in the very short term.
Bullish opening
Type : Bullish
Timeframe : Openning
A study of price movements over other periods shows the following variations:
New HIGH record (5 years)
Type : Bullish
Timeframe : Weekly
Near a new HIGH record (1 year)
Type : Bullish
Timeframe : Weekly
Near a new HIGH record (1st january)
Type : Bullish
Timeframe : Weekly
Near a new HIGH record (1 month)
Type : Bullish
Timeframe : Weekly
Technical
A technical analysis in 15 min. of this GOLD - USD chart shows a slightly bullish trend. Only 60.71% of the signals given by moving averages are bullish. This slightly bullish trend could return to neutral given the neutral signals also given by short-term moving averages. The Central Indicators market scanner currently does not detect any result that concerns moving averages.
In fact, 10 technical indicators on 18 studied are currently positioned bearish. Caution: the Central Indicators scanner currently detects an excess:
CCI indicator is oversold : under -100
Type : Neutral
Timeframe : 15 minutes
Williams %R indicator is oversold : under -80
Type : Neutral
Timeframe : 15 minutes
Pivot points : price is over resistance 1
Type : Neutral
Timeframe : Weekly
No signals are given by Central Patterns, a market scanner specialised in chart patterns, resistances and supports.
The Central Candlesticks scanner which studies Japanese candlesticks did not detect anything.
| S3 | S2 | S1 | Price | R1 | R2 | |
|---|---|---|---|---|---|---|
| ProTrendLines | 2,785.43 | 2,807.22 | 2,834.23 | 2,863.16 | 2,870.30 | 2,882.50 |
| Change (%) | -2.71% | -1.95% | -1.01% | - | +0.25% | +0.68% |
| Change | -77.73 | -55.94 | -28.93 | - | +7.14 | +19.34 |
| Level | Minor | Minor | Minor | - | Minor | Intermediate |
To determine price objectives, it is also possible to use the pivot points. Here is the price position in relation to pivot points:
| Pivot points | S3 | S2 | S1 | PP | R1 | R2 | R3 |
|---|---|---|---|---|---|---|---|
| Standard | 2,797.88 | 2,816.06 | 2,837.03 | 2,855.21 | 2,876.18 | 2,894.36 | 2,915.33 |
| Camarilla | 2,847.24 | 2,850.83 | 2,854.42 | 2,858.01 | 2,861.60 | 2,865.19 | 2,868.78 |
| Woodie | 2,799.29 | 2,816.76 | 2,838.44 | 2,855.91 | 2,877.59 | 2,895.06 | 2,916.74 |
| Fibonacci | 2,816.06 | 2,831.01 | 2,840.25 | 2,855.21 | 2,870.16 | 2,879.40 | 2,894.36 |
| Pivot points | S3 | S2 | S1 | PP | R1 | R2 | R3 |
|---|---|---|---|---|---|---|---|
| Standard | 2,662.12 | 2,696.34 | 2,748.77 | 2,782.99 | 2,835.42 | 2,869.64 | 2,922.07 |
| Camarilla | 2,777.38 | 2,785.32 | 2,793.27 | 2,801.21 | 2,809.15 | 2,817.10 | 2,825.04 |
| Woodie | 2,671.24 | 2,700.89 | 2,757.89 | 2,787.54 | 2,844.54 | 2,874.19 | 2,931.19 |
| Fibonacci | 2,696.34 | 2,729.44 | 2,749.89 | 2,782.99 | 2,816.09 | 2,836.54 | 2,869.64 |
| Pivot points | S3 | S2 | S1 | PP | R1 | R2 | R3 |
|---|---|---|---|---|---|---|---|
| Standard | 2,469.07 | 2,541.90 | 2,671.55 | 2,744.38 | 2,874.03 | 2,946.86 | 3,076.51 |
| Camarilla | 2,745.53 | 2,764.09 | 2,782.65 | 2,801.21 | 2,819.77 | 2,838.33 | 2,856.89 |
| Woodie | 2,497.49 | 2,556.11 | 2,699.97 | 2,758.59 | 2,902.45 | 2,961.07 | 3,104.93 |
| Fibonacci | 2,541.90 | 2,619.24 | 2,667.03 | 2,744.38 | 2,821.72 | 2,869.51 | 2,946.86 |
Numerical data
The following are the details of the technical indicators and moving averages that were collected to generate this technical analysis:
| RSI (14): | 46.29 | |
| MACD (12,26,9): | 1.4700 | |
| Directional Movement: | -3.15 | |
| AROON (14): | -78.57 | |
| DEMA (21): | 2,867.59 | |
| Parabolic SAR (0,02-0,02-0,2): | 2,868.64 | |
| Elder Ray (13): | -2.32 | |
| Super Trend (3,10): | 2,862.51 | |
| Zig ZAG (10): | 2,863.48 | |
| VORTEX (21): | 1.0600 | |
| Stochastique (14,3,5): | 9.00 | |
| TEMA (21): | 2,866.99 | |
| Williams %R (14): | -93.32 | |
| Chande Momentum Oscillator (20): | -5.53 | |
| Repulse (5,40,3): | -0.1000 | |
| ROCnROLL: | -1 | |
| TRIX (15,9): | 0.0100 | |
| Courbe Coppock: | 0.02 |
| MA7: | 2,834.83 | |
| MA20: | 2,764.86 | |
| MA50: | 2,692.43 | |
| MA100: | 2,680.18 | |
| MAexp7: | 2,865.41 | |
| MAexp20: | 2,865.05 | |
| MAexp50: | 2,861.98 | |
| MAexp100: | 2,860.57 | |
| Price / MA7: | +1.00% | |
| Price / MA20: | +3.56% | |
| Price / MA50: | +6.34% | |
| Price / MA100: | +6.83% | |
| Price / MAexp7: | -0.07% | |
| Price / MAexp20: | -0.06% | |
| Price / MAexp50: | +0.05% | |
| Price / MAexp100: | +0.10% |
News
The latest news and videos published on GOLD - USD at the time of the analysis were as follows:
-
 XAU/USD Price Forecast Today, Technical Analysis (February 06): Gold Retreats After Record High
-
Gold (XAU/USD) Daily Price Forecast and Technical Analysis, February 6, 2025, #trading #gold #xau
-
XAU/USD Price Forecast Today, Technical Analysis (February 06): Gold Continues to Look Bullish
-
Technical Analysis on Gold, Oil, USDJPY
-
XAU/USD Price Forecast Today, Technical Analysis (February 05): Gold Hit New Record High Again
About author

Online


Add a comment
Comments
0 comments on the analysis GOLD - USD - 15 min.