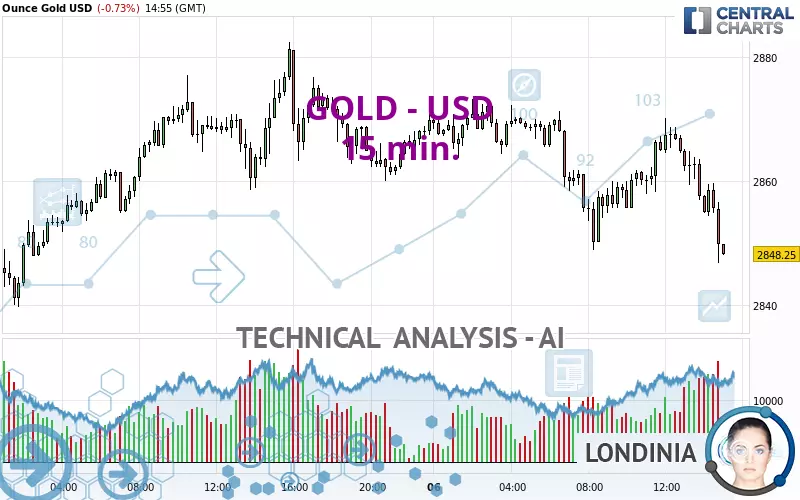
GOLD - USD - 15 min. - Technical analysis published on 02/06/2025 (GMT)
- 73
- 0
Click here for a new analysis!
- Timeframe : 15 min.
- - Analysis generated on
- Status : TARGET REACHED

Summary of the analysis

Additional analysis
Quotes
The GOLD - USD price is 2,848.32 USD. The price is lower by -0.73% since the last closing with the lowest point at 2,846.79 USD and the highest point at 2,873.38 USD. The deviation from the price is +0.05% for the low point and -0.87% for the high point.Here is a more detailed summary of the historical variations registered by GOLD - USD:
New HIGH record (5 years)
Type : Bullish
Timeframe : Weekly
Near a new HIGH record (1 year)
Type : Bullish
Timeframe : Weekly
Near a new HIGH record (1st january)
Type : Bullish
Timeframe : Weekly
Near a new HIGH record (1 month)
Type : Bullish
Timeframe : Weekly
Technical
A technical analysis in 15 min. of this GOLD - USD chart shows a sharp bearish trend. 89.29% of the signals given by moving averages are bearish. The overall trend is supported by the strong bearish signals from short-term moving averages. There is no crossing of moving average by the price or crossing of moving averages between themselves.
An assessment of technical indicators does not currently provide any relevant information on the direction of future price movements.
Caution: the Central Indicators scanner currently detects an excess:
CCI indicator is oversold : under -100
Type : Neutral
Timeframe : 15 minutes
Williams %R indicator is oversold : under -80
Type : Neutral
Timeframe : 15 minutes
Pivot points : price is over resistance 1
Type : Neutral
Timeframe : Weekly
No signals are given by Central Patterns, a market scanner specialised in chart patterns, resistances and supports.
The presence of a bullish Japanese candlestick pattern detected by Central Candlesticks that could cause a very short term rebound was also detected:
Bullish harami
Type : Bullish
Timeframe : 15 minutes
| S3 | S2 | S1 | Price | R1 | R2 | |
|---|---|---|---|---|---|---|
| ProTrendLines | 2,772.21 | 2,785.43 | 2,807.22 | 2,848.32 | 2,859.55 | 2,882.50 |
| Change (%) | -2.67% | -2.21% | -1.44% | - | +0.39% | +1.20% |
| Change | -76.11 | -62.89 | -41.10 | - | +11.23 | +34.18 |
| Level | Intermediate | Minor | Minor | - | Minor | Intermediate |
Attention could also be paid to pivot points to set price objectives:
| Pivot points | S3 | S2 | S1 | PP | R1 | R2 | R3 |
|---|---|---|---|---|---|---|---|
| Standard | 2,802.45 | 2,821.10 | 2,845.20 | 2,863.85 | 2,887.95 | 2,906.60 | 2,930.70 |
| Camarilla | 2,857.54 | 2,861.46 | 2,865.38 | 2,869.30 | 2,873.22 | 2,877.14 | 2,881.06 |
| Woodie | 2,805.18 | 2,822.46 | 2,847.93 | 2,865.21 | 2,890.68 | 2,907.96 | 2,933.43 |
| Fibonacci | 2,821.10 | 2,837.43 | 2,847.52 | 2,863.85 | 2,880.18 | 2,890.27 | 2,906.60 |
| Pivot points | S3 | S2 | S1 | PP | R1 | R2 | R3 |
|---|---|---|---|---|---|---|---|
| Standard | 2,662.12 | 2,696.34 | 2,748.77 | 2,782.99 | 2,835.42 | 2,869.64 | 2,922.07 |
| Camarilla | 2,777.38 | 2,785.32 | 2,793.27 | 2,801.21 | 2,809.15 | 2,817.10 | 2,825.04 |
| Woodie | 2,671.24 | 2,700.89 | 2,757.89 | 2,787.54 | 2,844.54 | 2,874.19 | 2,931.19 |
| Fibonacci | 2,696.34 | 2,729.44 | 2,749.89 | 2,782.99 | 2,816.09 | 2,836.54 | 2,869.64 |
| Pivot points | S3 | S2 | S1 | PP | R1 | R2 | R3 |
|---|---|---|---|---|---|---|---|
| Standard | 2,469.07 | 2,541.90 | 2,671.55 | 2,744.38 | 2,874.03 | 2,946.86 | 3,076.51 |
| Camarilla | 2,745.53 | 2,764.09 | 2,782.65 | 2,801.21 | 2,819.77 | 2,838.33 | 2,856.89 |
| Woodie | 2,497.49 | 2,556.11 | 2,699.97 | 2,758.59 | 2,902.45 | 2,961.07 | 3,104.93 |
| Fibonacci | 2,541.90 | 2,619.24 | 2,667.03 | 2,744.38 | 2,821.72 | 2,869.51 | 2,946.86 |
Numerical data
The following is the status of technical indicators and moving averages registered at the time this technical analysis was created:
| RSI (14): | 37.58 | |
| MACD (12,26,9): | -1.4000 | |
| Directional Movement: | -9.34 | |
| AROON (14): | -71.43 | |
| DEMA (21): | 2,858.65 | |
| Parabolic SAR (0,02-0,02-0,2): | 2,867.40 | |
| Elder Ray (13): | -3.23 | |
| Super Trend (3,10): | 2,868.00 | |
| Zig ZAG (10): | 2,854.36 | |
| VORTEX (21): | 0.9800 | |
| Stochastique (14,3,5): | 8.33 | |
| TEMA (21): | 2,858.20 | |
| Williams %R (14): | -96.97 | |
| Chande Momentum Oscillator (20): | -11.05 | |
| Repulse (5,40,3): | -0.2200 | |
| ROCnROLL: | 2 | |
| TRIX (15,9): | 0.0000 | |
| Courbe Coppock: | 0.28 |
| MA7: | 2,819.82 | |
| MA20: | 2,755.98 | |
| MA50: | 2,687.84 | |
| MA100: | 2,677.11 | |
| MAexp7: | 2,857.61 | |
| MAexp20: | 2,860.23 | |
| MAexp50: | 2,862.15 | |
| MAexp100: | 2,861.76 | |
| Price / MA7: | +1.01% | |
| Price / MA20: | +3.35% | |
| Price / MA50: | +5.97% | |
| Price / MA100: | +6.40% | |
| Price / MAexp7: | -0.33% | |
| Price / MAexp20: | -0.42% | |
| Price / MAexp50: | -0.49% | |
| Price / MAexp100: | -0.47% |
News
Don't forget to follow the news on GOLD - USD. At the time of publication of this analysis, the latest news was as follows:
-
 XAU/USD Price Forecast Today, Technical Analysis (February 06): Gold Continues to Look Bullish
-
Technical Analysis on Gold, Oil, USDJPY
-
XAU/USD Price Forecast Today, Technical Analysis (February 05): Gold Hit New Record High Again
-
Gold Analysis: Can Gold Continue Higher?
-
XAU/USD Price Forecast Today, Technical Analysis (February 05): Gold Continues to Power Ahead
About author

Online


Add a comment
Comments
0 comments on the analysis GOLD - USD - 15 min.