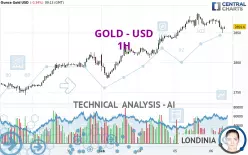
GOLD - USD - 1H - Technical analysis published on 02/06/2025 (GMT)
- 79
- 0
Click here for a new analysis!
- Timeframe : 1H
- - Analysis generated on
- Status : LEVEL MAINTAINED

Summary of the analysis

Additional analysis
Quotes
The GOLD - USD price is 2,859.60 USD. The price registered a decrease of -0.34% on the session with the lowest point at 2,848.89 USD and the highest point at 2,873.38 USD. The deviation from the price is +0.38% for the low point and -0.48% for the high point.A study of price movements over other periods shows the following variations:
New HIGH record (5 years)
Type : Bullish
Timeframe : Weekly
Near a new HIGH record (1 year)
Type : Bullish
Timeframe : Weekly
Near a new HIGH record (1st january)
Type : Bullish
Timeframe : Weekly
Near a new HIGH record (1 month)
Type : Bullish
Timeframe : Weekly
Technical
Technical analysis of GOLD - USD in 1H shows an overall bullish trend. 71.43% of the signals given by moving averages are bullish. Caution: the neutral signals currently given by short-term moving averages show us that the global trend is losing momentum. The Central Indicators scanner does not detect any result on moving averages that would impact this trend.
An assessment of technical indicators does not currently provide any relevant information to suggest whether the signal given by the technical indicators is more bullish or bearish.
But beware of excesses. The Central Indicators scanner currently detects this:
CCI indicator is oversold : under -100
Type : Neutral
Timeframe : 1 hour
Pivot points : price is over resistance 1
Type : Neutral
Timeframe : Weekly
No signals are given by Central Patterns, a market scanner specialised in chart patterns, resistances and supports.
The Central Candlesticks scanner currently notes the presence of this pattern in Japanese candlesticks that could mark the end of the short-term trend currently underway:
Doji
Type : Neutral
Timeframe : 1 hour
| S3 | S2 | S1 | Price | R1 | |
|---|---|---|---|---|---|
| ProTrendLines | 2,785.43 | 2,807.22 | 2,859.55 | 2,859.60 | 2,882.50 |
| Change (%) | -2.59% | -1.83% | +0.00% | - | +0.80% |
| Change | -74.17 | -52.38 | -0.05 | - | +22.90 |
| Level | Minor | Minor | Minor | - | Intermediate |
Pivot points can also be used to set your price objectives. Here is the price situation in relation to pivot points:
| Pivot points | S3 | S2 | S1 | PP | R1 | R2 | R3 |
|---|---|---|---|---|---|---|---|
| Standard | 2,802.45 | 2,821.10 | 2,845.20 | 2,863.85 | 2,887.95 | 2,906.60 | 2,930.70 |
| Camarilla | 2,857.54 | 2,861.46 | 2,865.38 | 2,869.30 | 2,873.22 | 2,877.14 | 2,881.06 |
| Woodie | 2,805.18 | 2,822.46 | 2,847.93 | 2,865.21 | 2,890.68 | 2,907.96 | 2,933.43 |
| Fibonacci | 2,821.10 | 2,837.43 | 2,847.52 | 2,863.85 | 2,880.18 | 2,890.27 | 2,906.60 |
| Pivot points | S3 | S2 | S1 | PP | R1 | R2 | R3 |
|---|---|---|---|---|---|---|---|
| Standard | 2,662.12 | 2,696.34 | 2,748.77 | 2,782.99 | 2,835.42 | 2,869.64 | 2,922.07 |
| Camarilla | 2,777.38 | 2,785.32 | 2,793.27 | 2,801.21 | 2,809.15 | 2,817.10 | 2,825.04 |
| Woodie | 2,671.24 | 2,700.89 | 2,757.89 | 2,787.54 | 2,844.54 | 2,874.19 | 2,931.19 |
| Fibonacci | 2,696.34 | 2,729.44 | 2,749.89 | 2,782.99 | 2,816.09 | 2,836.54 | 2,869.64 |
| Pivot points | S3 | S2 | S1 | PP | R1 | R2 | R3 |
|---|---|---|---|---|---|---|---|
| Standard | 2,469.07 | 2,541.90 | 2,671.55 | 2,744.38 | 2,874.03 | 2,946.86 | 3,076.51 |
| Camarilla | 2,745.53 | 2,764.09 | 2,782.65 | 2,801.21 | 2,819.77 | 2,838.33 | 2,856.89 |
| Woodie | 2,497.49 | 2,556.11 | 2,699.97 | 2,758.59 | 2,902.45 | 2,961.07 | 3,104.93 |
| Fibonacci | 2,541.90 | 2,619.24 | 2,667.03 | 2,744.38 | 2,821.72 | 2,869.51 | 2,946.86 |
Numerical data
The following are the details of the technical indicators and moving averages that were collected to generate this technical analysis:
| RSI (14): | 42.26 | |
| MACD (12,26,9): | 1.5400 | |
| Directional Movement: | -16.74 | |
| AROON (14): | -100.00 | |
| DEMA (21): | 2,867.62 | |
| Parabolic SAR (0,02-0,02-0,2): | 2,876.24 | |
| Elder Ray (13): | -10.38 | |
| Super Trend (3,10): | 2,852.50 | |
| Zig ZAG (10): | 2,856.03 | |
| VORTEX (21): | 0.9000 | |
| Stochastique (14,3,5): | 12.60 | |
| TEMA (21): | 2,861.89 | |
| Williams %R (14): | -72.27 | |
| Chande Momentum Oscillator (20): | -6.86 | |
| Repulse (5,40,3): | -0.2600 | |
| ROCnROLL: | -1 | |
| TRIX (15,9): | 0.0200 | |
| Courbe Coppock: | 0.43 |
| MA7: | 2,819.62 | |
| MA20: | 2,756.04 | |
| MA50: | 2,687.87 | |
| MA100: | 2,677.13 | |
| MAexp7: | 2,861.63 | |
| MAexp20: | 2,863.85 | |
| MAexp50: | 2,852.79 | |
| MAexp100: | 2,833.49 | |
| Price / MA7: | +1.42% | |
| Price / MA20: | +3.76% | |
| Price / MA50: | +6.39% | |
| Price / MA100: | +6.82% | |
| Price / MAexp7: | -0.07% | |
| Price / MAexp20: | -0.15% | |
| Price / MAexp50: | +0.24% | |
| Price / MAexp100: | +0.92% |
News
The last news published on GOLD - USD at the time of the generation of this analysis was as follows:
-
 XAU/USD Price Forecast Today, Technical Analysis (February 05): Gold Hit New Record High Again
-
Gold Analysis: Can Gold Continue Higher?
-
XAU/USD Price Forecast Today, Technical Analysis (February 05): Gold Continues to Power Ahead
-
XAU/USD Price Forecast Today, Technical Analysis (February 04): Gold Hits New Record Highs
-
XAU/USD Price Forecast Today, Technical Analysis (February 04): Gold Continues to See Buying
About author

Online


Add a comment
Comments
0 comments on the analysis GOLD - USD - 1H