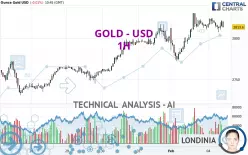
GOLD - USD - 1H - Technical analysis published on 02/04/2025 (GMT)
- 79
- 0
Click here for a new analysis!
- Timeframe : 1H
- - Analysis generated on
- Status : TARGET REACHED

Summary of the analysis

Additional analysis
Quotes
GOLD - USD rating 2,813.67 USD. On the day, this instrument lost -0.01% and was traded between 2,807.22 USD and 2,824.69 USD over the period. The price is currently at +0.23% from its lowest and -0.39% from its highest.The Central Gaps scanner detects a bullish opening. A small advantage for buyers in the very short term.
Bullish opening
Type : Bullish
Timeframe : Openning
So that you have an overall view of the price change, here is a table showing the variations over several periods:
New HIGH record (5 years)
Type : Bullish
Timeframe : Weekly
Near a new HIGH record (1 year)
Type : Bullish
Timeframe : Weekly
Near a new HIGH record (1st january)
Type : Bullish
Timeframe : Weekly
Near a new HIGH record (1 month)
Type : Bullish
Timeframe : Weekly
Technical
Technical analysis of this 1H chart of GOLD - USD indicates that the overall trend is bullish. 71.43% of the signals given by moving averages are bullish. Caution: the neutral signals currently given by the short-term moving averages indicate that this bullish trend is showing signs of running out of steam. An assessment of moving averages reveals a bearish signal that could impact this trend:
Bearish price crossover with Moving Average 20
Type : Bearish
Timeframe : 1 hour
In fact, of the 18 technical indicators analysed by Central Analyzer, 4 are bullish, 7 are neutral and 7 are bearish. Central Indicators, the scanner specialised in technical indicators, has identified these signals:
Momentum indicator is back under 0
Type : Bearish
Timeframe : 1 hour
Williams %R indicator is back under -50
Type : Bearish
Timeframe : 1 hour
The analysis of the price chart with Central Patterns scanners does not return any result.
The Central Candlesticks scanner, specialised in Japanese candlesticks, did not identify any signals.
| S3 | S2 | S1 | Price | R1 | R2 | |
|---|---|---|---|---|---|---|
| ProTrendLines | 2,744.89 | 2,772.21 | 2,785.43 | 2,813.67 | 2,817.20 | 2,830.69 |
| Change (%) | -2.44% | -1.47% | -1.00% | - | +0.13% | +0.60% |
| Change | -68.78 | -41.46 | -28.24 | - | +3.53 | +17.02 |
| Level | Intermediate | Intermediate | Intermediate | - | Minor | Intermediate |
Pivot points can also be used to set your price objectives. Here is the price situation in relation to pivot points:
| Pivot points | S3 | S2 | S1 | PP | R1 | R2 | R3 |
|---|---|---|---|---|---|---|---|
| Standard | 2,722.15 | 2,747.20 | 2,780.60 | 2,805.65 | 2,839.05 | 2,864.10 | 2,897.50 |
| Camarilla | 2,797.94 | 2,803.29 | 2,808.65 | 2,814.01 | 2,819.37 | 2,824.73 | 2,830.08 |
| Woodie | 2,726.34 | 2,749.29 | 2,784.79 | 2,807.74 | 2,843.24 | 2,866.19 | 2,901.69 |
| Fibonacci | 2,747.20 | 2,769.53 | 2,783.32 | 2,805.65 | 2,827.98 | 2,841.77 | 2,864.10 |
| Pivot points | S3 | S2 | S1 | PP | R1 | R2 | R3 |
|---|---|---|---|---|---|---|---|
| Standard | 2,662.12 | 2,696.34 | 2,748.77 | 2,782.99 | 2,835.42 | 2,869.64 | 2,922.07 |
| Camarilla | 2,777.38 | 2,785.32 | 2,793.27 | 2,801.21 | 2,809.15 | 2,817.10 | 2,825.04 |
| Woodie | 2,671.24 | 2,700.89 | 2,757.89 | 2,787.54 | 2,844.54 | 2,874.19 | 2,931.19 |
| Fibonacci | 2,696.34 | 2,729.44 | 2,749.89 | 2,782.99 | 2,816.09 | 2,836.54 | 2,869.64 |
| Pivot points | S3 | S2 | S1 | PP | R1 | R2 | R3 |
|---|---|---|---|---|---|---|---|
| Standard | 2,469.07 | 2,541.90 | 2,671.55 | 2,744.38 | 2,874.03 | 2,946.86 | 3,076.51 |
| Camarilla | 2,745.53 | 2,764.09 | 2,782.65 | 2,801.21 | 2,819.77 | 2,838.33 | 2,856.89 |
| Woodie | 2,497.49 | 2,556.11 | 2,699.97 | 2,758.59 | 2,902.45 | 2,961.07 | 3,104.93 |
| Fibonacci | 2,541.90 | 2,619.24 | 2,667.03 | 2,744.38 | 2,821.72 | 2,869.51 | 2,946.86 |
Numerical data
The following is the status of technical indicators and moving averages registered at the time this technical analysis was created:
| RSI (14): | 51.67 | |
| MACD (12,26,9): | 3.2700 | |
| Directional Movement: | 4.86 | |
| AROON (14): | -35.71 | |
| DEMA (21): | 2,819.62 | |
| Parabolic SAR (0,02-0,02-0,2): | 2,825.32 | |
| Elder Ray (13): | 0.50 | |
| Super Trend (3,10): | 2,799.01 | |
| Zig ZAG (10): | 2,814.09 | |
| VORTEX (21): | 1.0300 | |
| Stochastique (14,3,5): | 53.60 | |
| TEMA (21): | 2,818.44 | |
| Williams %R (14): | -60.50 | |
| Chande Momentum Oscillator (20): | -2.59 | |
| Repulse (5,40,3): | -0.0700 | |
| ROCnROLL: | -1 | |
| TRIX (15,9): | 0.0200 | |
| Courbe Coppock: | 0.06 |
| MA7: | 2,784.34 | |
| MA20: | 2,735.05 | |
| MA50: | 2,677.68 | |
| MA100: | 2,671.18 | |
| MAexp7: | 2,816.28 | |
| MAexp20: | 2,814.63 | |
| MAexp50: | 2,806.08 | |
| MAexp100: | 2,793.62 | |
| Price / MA7: | +1.05% | |
| Price / MA20: | +2.87% | |
| Price / MA50: | +5.08% | |
| Price / MA100: | +5.33% | |
| Price / MAexp7: | -0.09% | |
| Price / MAexp20: | -0.03% | |
| Price / MAexp50: | +0.27% | |
| Price / MAexp100: | +0.72% |
News
The latest news and videos published on GOLD - USD at the time of the analysis were as follows:
-
 XAU/USD Price Forecast Today, Technical Analysis (February 03): Gold Has a Wild Ride on Monday
-
XAU/USD Price Forecast Today, Technical Analysis (January 31): Gold Continues to Power Higher
-
Gold @ all time high and traders look towards $3,000 oz
-
XAU/USD Price Forecast Today, Technical Analysis (January 30): Gold Surged to a Record High
-
Gold (XAU/USD) Daily Price Forecast and Technical Analysis, January 30, 2025, #gold #xauusd #xau
About author

Online


Add a comment
Comments
0 comments on the analysis GOLD - USD - 1H