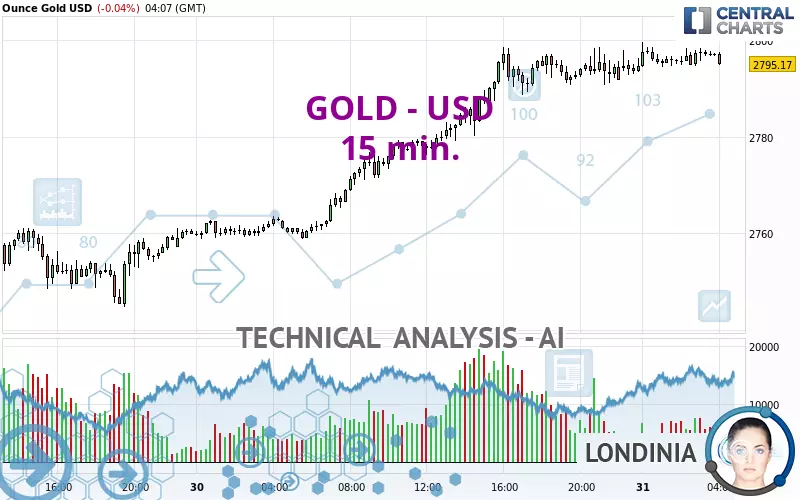
GOLD - USD - 15 min. - Technical analysis published on 01/31/2025 (GMT)
- 258
- 0
Click here for a new analysis!
- Timeframe : 15 min.
- - Analysis generated on
- Status : LEVEL MAINTAINED

Summary of the analysis

Additional analysis
Quotes
The GOLD - USD price is 2,795.20 USD. On the day, this instrument lost -0.04% with the lowest point at 2,794.40 USD and the highest point at 2,799.67 USD. The deviation from the price is +0.03% for the low point and -0.16% for the high point.A bullish opening was detected by the Central Gaps scanner. Buyers are trying to impose a bullish momentum in the very short term.
Bullish opening
Type : Bullish
Timeframe : Openning
So that you have an overall view of the price change, here is a table showing the variations over several periods:
New HIGH record (5 years)
Type : Bullish
Timeframe : Weekly
New HIGH record (1 year)
Type : Bullish
Timeframe : Weekly
New HIGH record (1st january)
Type : Bullish
Timeframe : Weekly
New HIGH record (1 month)
Type : Bullish
Timeframe : Weekly
Technical
A technical analysis in 15 min. of this GOLD - USD chart shows a bullish trend. The signals given by moving averages are 78.57% bullish. This bullish trend could slow down given the neutral signals currently being given by short-term moving averages. There is no crossing of moving average by the price or crossing of moving averages between themselves.
The probability of a further increase is slight given the direction of the technical indicators.
Central Indicators, the detector scanner for these technical indicators recently detected a signal:
Aroon indicator bearish trend
Type : Bearish
Timeframe : 15 minutes
Central Patterns, the scanner specializing in chart patterns, did not identify any signals.
The Central Candlesticks scanner currently notes the presence of this pattern in Japanese candlesticks that could mark the end of the short-term trend currently underway:
Doji
Type : Neutral
Timeframe : 15 minutes
| S3 | S2 | S1 | Price | R1 | |
|---|---|---|---|---|---|
| ProTrendLines | 2,744.94 | 2,766.22 | 2,785.43 | 2,795.20 | 2,798.61 |
| Change (%) | -1.80% | -1.04% | -0.35% | - | +0.12% |
| Change | -50.26 | -28.98 | -9.77 | - | +3.41 |
| Level | Intermediate | Intermediate | Major | - | Intermediate |
Attention could also be paid to pivot points to set price objectives:
| Pivot points | S3 | S2 | S1 | PP | R1 | R2 | R3 |
|---|---|---|---|---|---|---|---|
| Standard | 2,730.69 | 2,744.75 | 2,770.50 | 2,784.56 | 2,810.31 | 2,824.37 | 2,850.12 |
| Camarilla | 2,785.31 | 2,788.96 | 2,792.61 | 2,796.26 | 2,799.91 | 2,803.56 | 2,807.21 |
| Woodie | 2,736.55 | 2,747.67 | 2,776.36 | 2,787.48 | 2,816.17 | 2,827.29 | 2,855.98 |
| Fibonacci | 2,744.75 | 2,759.95 | 2,769.35 | 2,784.56 | 2,799.76 | 2,809.16 | 2,824.37 |
| Pivot points | S3 | S2 | S1 | PP | R1 | R2 | R3 |
|---|---|---|---|---|---|---|---|
| Standard | 2,614.84 | 2,652.12 | 2,711.40 | 2,748.68 | 2,807.96 | 2,845.24 | 2,904.52 |
| Camarilla | 2,744.14 | 2,752.99 | 2,761.84 | 2,770.69 | 2,779.54 | 2,788.39 | 2,797.24 |
| Woodie | 2,625.85 | 2,657.62 | 2,722.41 | 2,754.18 | 2,818.97 | 2,850.74 | 2,915.53 |
| Fibonacci | 2,652.12 | 2,689.00 | 2,711.79 | 2,748.68 | 2,785.56 | 2,808.35 | 2,845.24 |
| Pivot points | S3 | S2 | S1 | PP | R1 | R2 | R3 |
|---|---|---|---|---|---|---|---|
| Standard | 2,419.40 | 2,501.32 | 2,562.46 | 2,644.38 | 2,705.52 | 2,787.44 | 2,848.58 |
| Camarilla | 2,584.26 | 2,597.37 | 2,610.49 | 2,623.60 | 2,636.71 | 2,649.83 | 2,662.94 |
| Woodie | 2,409.01 | 2,496.13 | 2,552.07 | 2,639.19 | 2,695.13 | 2,782.25 | 2,838.19 |
| Fibonacci | 2,501.32 | 2,555.97 | 2,589.73 | 2,644.38 | 2,699.03 | 2,732.79 | 2,787.44 |
Numerical data
The following is the status of the technical indicators and moving averages at the time of publication of this technical analysis:
| RSI (14): | 56.84 | |
| MACD (12,26,9): | 1.0100 | |
| Directional Movement: | 5.69 | |
| AROON (14): | -14.29 | |
| DEMA (21): | 2,797.56 | |
| Parabolic SAR (0,02-0,02-0,2): | 2,799.20 | |
| Elder Ray (13): | 0.63 | |
| Super Trend (3,10): | 2,790.67 | |
| Zig ZAG (10): | 2,797.06 | |
| VORTEX (21): | 1.0600 | |
| Stochastique (14,3,5): | 58.83 | |
| TEMA (21): | 2,796.84 | |
| Williams %R (14): | -38.26 | |
| Chande Momentum Oscillator (20): | 1.22 | |
| Repulse (5,40,3): | -0.0100 | |
| ROCnROLL: | 1 | |
| TRIX (15,9): | 0.0100 | |
| Courbe Coppock: | 0.07 |
| MA7: | 2,768.84 | |
| MA20: | 2,717.60 | |
| MA50: | 2,672.71 | |
| MA100: | 2,666.22 | |
| MAexp7: | 2,796.87 | |
| MAexp20: | 2,796.08 | |
| MAexp50: | 2,792.36 | |
| MAexp100: | 2,784.86 | |
| Price / MA7: | +0.95% | |
| Price / MA20: | +2.86% | |
| Price / MA50: | +4.58% | |
| Price / MA100: | +4.84% | |
| Price / MAexp7: | -0.06% | |
| Price / MAexp20: | -0.03% | |
| Price / MAexp50: | +0.10% | |
| Price / MAexp100: | +0.37% |
News
The last news published on GOLD - USD at the time of the generation of this analysis was as follows:
-
 XAU/USD Price Forecast Today, Technical Analysis (January 30): Gold Surged to a Record High
-
Gold (XAU/USD) Daily Price Forecast and Technical Analysis, January 30, 2025, #gold #xauusd #xau
-
XAU/USD Price Forecast Today, Technical Analysis (January 30): Gold Rallies Hard on Thursday
-
XAU/USD Price Forecast Today, Technical Analysis (January 29): Gold Tests Resistance
-
XAU/USD Price Forecast Today, Technical Analysis (January 29): Gold May Pull Back Ahead of the Fed
About author

Online


Add a comment
Comments
0 comments on the analysis GOLD - USD - 15 min.