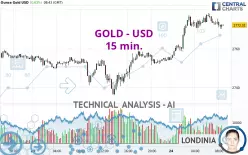
GOLD - USD - 15 min. - Technical analysis published on 01/24/2025 (GMT)
- 98
- 0
Click here for a new analysis!
- Timeframe : 15 min.
- - Analysis generated on
- Status : LEVEL MAINTAINED

Summary of the analysis

Additional analysis
Quotes
The GOLD - USD price is 2,772.01 USD. The price has increased by +0.63% since the last closing with the lowest point at 2,754.28 USD and the highest point at 2,778.32 USD. The deviation from the price is +0.64% for the low point and -0.23% for the high point.A study of price movements over other periods shows the following variations:
Near a new HIGH record (5 years)
Type : Bullish
Timeframe : Weekly
Near a new HIGH record (1 year)
Type : Bullish
Timeframe : Weekly
New HIGH record (1st january)
Type : Bullish
Timeframe : Weekly
New HIGH record (1 month)
Type : Bullish
Timeframe : Weekly
Technical
Technical analysis of GOLD - USD in 15 min. shows an overall bullish trend. The signals given by moving averages are 71.43% bullish. This bullish trend could slow down given the neutral signals currently being given by short-term moving averages. The Central Indicators scanner detects bearish signals on moving averages that could impact this trend:
Bearish trend reversal : Moving Average 20
Type : Bearish
Timeframe : 15 minutes
Bearish trend reversal : adaptative moving average 20
Type : Bearish
Timeframe : 15 minutes
An assessment of technical indicators does not currently provide any relevant information to suggest whether the signal given by the technical indicators is more bullish or bearish.
Caution: the Central Indicators scanner currently detects an excess:
CCI indicator is oversold : under -100
Type : Neutral
Timeframe : 15 minutes
Williams %R indicator is oversold : under -80
Type : Neutral
Timeframe : 15 minutes
Pivot points : price is over resistance 1
Type : Neutral
Timeframe : 15 minutes
Pivot points : price is over resistance 2
Type : Neutral
Timeframe : Weekly
The analysis of the price chart with Central Patterns scanners does not return any result.
The Central Candlesticks scanner, specialised in Japanese candlesticks, did not identify any signals.
| S3 | S2 | S1 | Price | R1 | |
|---|---|---|---|---|---|
| ProTrendLines | 2,718.86 | 2,735.93 | 2,763.50 | 2,772.01 | 2,785.43 |
| Change (%) | -1.92% | -1.30% | -0.31% | - | +0.48% |
| Change | -53.15 | -36.08 | -8.51 | - | +13.42 |
| Level | Intermediate | Minor | Intermediate | - | Major |
To determine price objectives, it is also possible to use the pivot points. Here is the price position in relation to pivot points:
| Pivot points | S3 | S2 | S1 | PP | R1 | R2 | R3 |
|---|---|---|---|---|---|---|---|
| Standard | 2,717.67 | 2,726.80 | 2,740.71 | 2,749.84 | 2,763.75 | 2,772.88 | 2,786.79 |
| Camarilla | 2,748.28 | 2,750.40 | 2,752.51 | 2,754.62 | 2,756.73 | 2,758.84 | 2,760.96 |
| Woodie | 2,720.06 | 2,728.00 | 2,743.10 | 2,751.04 | 2,766.14 | 2,774.08 | 2,789.18 |
| Fibonacci | 2,726.80 | 2,735.60 | 2,741.04 | 2,749.84 | 2,758.64 | 2,764.08 | 2,772.88 |
| Pivot points | S3 | S2 | S1 | PP | R1 | R2 | R3 |
|---|---|---|---|---|---|---|---|
| Standard | 2,595.02 | 2,625.92 | 2,662.93 | 2,693.83 | 2,730.84 | 2,761.74 | 2,798.75 |
| Camarilla | 2,681.26 | 2,687.48 | 2,693.71 | 2,699.93 | 2,706.16 | 2,712.38 | 2,718.61 |
| Woodie | 2,598.07 | 2,627.45 | 2,665.98 | 2,695.36 | 2,733.89 | 2,763.27 | 2,801.80 |
| Fibonacci | 2,625.92 | 2,651.87 | 2,667.89 | 2,693.83 | 2,719.78 | 2,735.80 | 2,761.74 |
| Pivot points | S3 | S2 | S1 | PP | R1 | R2 | R3 |
|---|---|---|---|---|---|---|---|
| Standard | 2,419.40 | 2,501.32 | 2,562.46 | 2,644.38 | 2,705.52 | 2,787.44 | 2,848.58 |
| Camarilla | 2,584.26 | 2,597.37 | 2,610.49 | 2,623.60 | 2,636.71 | 2,649.83 | 2,662.94 |
| Woodie | 2,409.01 | 2,496.13 | 2,552.07 | 2,639.19 | 2,695.13 | 2,782.25 | 2,838.19 |
| Fibonacci | 2,501.32 | 2,555.97 | 2,589.73 | 2,644.38 | 2,699.03 | 2,732.79 | 2,787.44 |
Numerical data
The following is the status of the technical indicators and moving averages at the time of publication of this technical analysis:
| RSI (14): | 55.09 | |
| MACD (12,26,9): | 2.3100 | |
| Directional Movement: | 5.02 | |
| AROON (14): | -57.14 | |
| DEMA (21): | 2,775.91 | |
| Parabolic SAR (0,02-0,02-0,2): | 2,778.32 | |
| Elder Ray (13): | -1.40 | |
| Super Trend (3,10): | 2,768.62 | |
| Zig ZAG (10): | 2,771.05 | |
| VORTEX (21): | 0.9400 | |
| Stochastique (14,3,5): | 12.90 | |
| TEMA (21): | 2,773.93 | |
| Williams %R (14): | -86.36 | |
| Chande Momentum Oscillator (20): | -3.55 | |
| Repulse (5,40,3): | -0.0200 | |
| ROCnROLL: | -1 | |
| TRIX (15,9): | 0.0200 | |
| Courbe Coppock: | 0.00 |
| MA7: | 2,735.96 | |
| MA20: | 2,682.15 | |
| MA50: | 2,656.14 | |
| MA100: | 2,653.17 | |
| MAexp7: | 2,772.87 | |
| MAexp20: | 2,772.37 | |
| MAexp50: | 2,766.58 | |
| MAexp100: | 2,761.09 | |
| Price / MA7: | +1.32% | |
| Price / MA20: | +3.35% | |
| Price / MA50: | +4.36% | |
| Price / MA100: | +4.48% | |
| Price / MAexp7: | -0.03% | |
| Price / MAexp20: | -0.01% | |
| Price / MAexp50: | +0.20% | |
| Price / MAexp100: | +0.40% |
News
Don't forget to follow the news on GOLD - USD. At the time of publication of this analysis, the latest news was as follows:
-
 XAU/USD Price Forecast Today, Technical Analysis (January 23): Gold Pulls Back but Recovers
-
XAU/USD Price Forecast Today, Technical Analysis (January 23): Gold Pulls Back Slightly
-
Technical Analysis on EURUSD, Gold, US dollar index
-
XAU/USD Price Forecast Today, Technical Analysis (January 22): Gold Gains Bullish Momentum
-
XAU/USD Price Forecast Today, Technical Analysis (January 22): Gold Continues to Reach Higher
About author

Online


Add a comment
Comments
0 comments on the analysis GOLD - USD - 15 min.