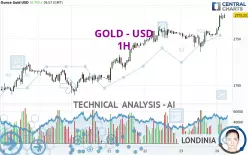
GOLD - USD - 1H - Technical analysis published on 01/24/2025 (GMT)
- 112
- 0
Click here for a new analysis!
- Timeframe : 1H
- - Analysis generated on
- Status : TARGET REACHED

Summary of the analysis

Additional analysis
Quotes
The GOLD - USD price is 2,775.21 USD. The price has increased by +0.75% since the last closing and was between 2,754.28 USD and 2,777.40 USD. This implies that the price is at +0.76% from its lowest and at -0.08% from its highest.Here is a more detailed summary of the historical variations registered by GOLD - USD:
Near a new HIGH record (5 years)
Type : Bullish
Timeframe : Weekly
Near a new HIGH record (1 year)
Type : Bullish
Timeframe : Weekly
New HIGH record (1st january)
Type : Bullish
Timeframe : Weekly
New HIGH record (1 month)
Type : Bullish
Timeframe : Weekly
Technical
Technical analysis of this 1H chart of GOLD - USD indicates that the overall trend is strongly bullish. 92.86% of the signals given by moving averages are bullish. The overall trend is supported by the strong bullish signals from short-term moving averages. There is no crossing of moving average by the price or crossing of moving averages between themselves.
In fact, 15 technical indicators on 18 studied are currently positioned bullish. Central Indicators, the scanner specialised in technical indicators, has identified these signals:
Pivot points : price is over resistance 2
Type : Neutral
Timeframe : 1 hour
Pivot points : price is over resistance 2
Type : Neutral
Timeframe : Weekly
No signals are given by Central Patterns, a market scanner specialised in chart patterns, resistances and supports.
Central Candlesticks, the scanner specialised in Japanese candlesticks, detects a bullish signal that could support the hypothesis of a small rebound in the very short term:
Bullish engulfing lines
Type : Bullish
Timeframe : 1 hour
| S3 | S2 | S1 | Price | R1 | |
|---|---|---|---|---|---|
| ProTrendLines | 2,718.86 | 2,735.93 | 2,763.50 | 2,775.21 | 2,785.43 |
| Change (%) | -2.03% | -1.42% | -0.42% | - | +0.37% |
| Change | -56.35 | -39.28 | -11.71 | - | +10.22 |
| Level | Intermediate | Minor | Intermediate | - | Major |
To determine price objectives, it is also possible to use the pivot points. Here is the price position in relation to pivot points:
| Pivot points | S3 | S2 | S1 | PP | R1 | R2 | R3 |
|---|---|---|---|---|---|---|---|
| Standard | 2,717.67 | 2,726.80 | 2,740.71 | 2,749.84 | 2,763.75 | 2,772.88 | 2,786.79 |
| Camarilla | 2,748.28 | 2,750.40 | 2,752.51 | 2,754.62 | 2,756.73 | 2,758.84 | 2,760.96 |
| Woodie | 2,720.06 | 2,728.00 | 2,743.10 | 2,751.04 | 2,766.14 | 2,774.08 | 2,789.18 |
| Fibonacci | 2,726.80 | 2,735.60 | 2,741.04 | 2,749.84 | 2,758.64 | 2,764.08 | 2,772.88 |
| Pivot points | S3 | S2 | S1 | PP | R1 | R2 | R3 |
|---|---|---|---|---|---|---|---|
| Standard | 2,595.02 | 2,625.92 | 2,662.93 | 2,693.83 | 2,730.84 | 2,761.74 | 2,798.75 |
| Camarilla | 2,681.26 | 2,687.48 | 2,693.71 | 2,699.93 | 2,706.16 | 2,712.38 | 2,718.61 |
| Woodie | 2,598.07 | 2,627.45 | 2,665.98 | 2,695.36 | 2,733.89 | 2,763.27 | 2,801.80 |
| Fibonacci | 2,625.92 | 2,651.87 | 2,667.89 | 2,693.83 | 2,719.78 | 2,735.80 | 2,761.74 |
| Pivot points | S3 | S2 | S1 | PP | R1 | R2 | R3 |
|---|---|---|---|---|---|---|---|
| Standard | 2,419.40 | 2,501.32 | 2,562.46 | 2,644.38 | 2,705.52 | 2,787.44 | 2,848.58 |
| Camarilla | 2,584.26 | 2,597.37 | 2,610.49 | 2,623.60 | 2,636.71 | 2,649.83 | 2,662.94 |
| Woodie | 2,409.01 | 2,496.13 | 2,552.07 | 2,639.19 | 2,695.13 | 2,782.25 | 2,838.19 |
| Fibonacci | 2,501.32 | 2,555.97 | 2,589.73 | 2,644.38 | 2,699.03 | 2,732.79 | 2,787.44 |
Numerical data
The following is the status of technical indicators and moving averages registered at the time this technical analysis was created:
| RSI (14): | 72.08 | |
| MACD (12,26,9): | 5.4200 | |
| Directional Movement: | 18.16 | |
| AROON (14): | 85.71 | |
| DEMA (21): | 2,766.55 | |
| Parabolic SAR (0,02-0,02-0,2): | 2,754.45 | |
| Elder Ray (13): | 10.83 | |
| Super Trend (3,10): | 2,757.62 | |
| Zig ZAG (10): | 2,774.03 | |
| VORTEX (21): | 1.1500 | |
| Stochastique (14,3,5): | 87.34 | |
| TEMA (21): | 2,769.88 | |
| Williams %R (14): | -10.07 | |
| Chande Momentum Oscillator (20): | 16.28 | |
| Repulse (5,40,3): | 0.1700 | |
| ROCnROLL: | 1 | |
| TRIX (15,9): | 0.0100 | |
| Courbe Coppock: | 1.33 |
| MA7: | 2,736.27 | |
| MA20: | 2,682.37 | |
| MA50: | 2,656.22 | |
| MA100: | 2,653.21 | |
| MAexp7: | 2,768.31 | |
| MAexp20: | 2,760.51 | |
| MAexp50: | 2,753.02 | |
| MAexp100: | 2,741.21 | |
| Price / MA7: | +1.42% | |
| Price / MA20: | +3.46% | |
| Price / MA50: | +4.48% | |
| Price / MA100: | +4.60% | |
| Price / MAexp7: | +0.25% | |
| Price / MAexp20: | +0.53% | |
| Price / MAexp50: | +0.80% | |
| Price / MAexp100: | +1.24% |
News
The latest news and videos published on GOLD - USD at the time of the analysis were as follows:
-
 XAU/USD Price Forecast Today, Technical Analysis (January 23): Gold Pulls Back but Recovers
-
XAU/USD Price Forecast Today, Technical Analysis (January 23): Gold Pulls Back Slightly
-
Technical Analysis on EURUSD, Gold, US dollar index
-
XAU/USD Price Forecast Today, Technical Analysis (January 22): Gold Gains Bullish Momentum
-
XAU/USD Price Forecast Today, Technical Analysis (January 22): Gold Continues to Reach Higher
About author

Online


Add a comment
Comments
0 comments on the analysis GOLD - USD - 1H