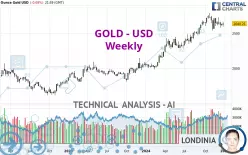
GOLD - USD - Weekly - Technical analysis published on 01/04/2025 (GMT)
- 227
- 0
- Who voted?
Click here for a new analysis!
- Timeframe : Weekly
- - Analysis generated on
- Status : TARGET REACHED

Summary of the analysis

Additional analysis
Quotes
The GOLD - USD rating is 2,640.21 USD. The price is up +0.82% over 5 days and was traded between 2,602.66 USD and 2,665.33 USD over the period. The price is currently at +1.44% from its lowest point and -0.94% from its highest point.So that you have an overall view of the price change, here is a table showing the variations over several periods:
Near a new HIGH record (5 years)
Type : Bullish
Timeframe : Weekly
Near a new HIGH record (1 year)
Type : Bullish
Timeframe : Weekly
New HIGH record (1st january)
Type : Bullish
Timeframe : Weekly
Near a new HIGH record (1 month)
Type : Bullish
Timeframe : Weekly
Technical
Technical analysis of GOLD - USD in Weekly shows a strongly overall bullish trend. 92.86% of the signals given by moving averages are bullish. The overall trend is supported by the strong bullish signals from short-term moving averages. The Central Indicators scanner detects a bullish signal on moving averages that could impact this trend:
Bullish price crossover with Moving Average 20
Type : Bullish
Timeframe : Weekly
In fact, Central Analyzer took into account 18 technical indicators and the result was as follows: 5 are bullish, 6 are neutral and 7 are bearish. Central Indicators, the detector scanner for these technical indicators recently detected a signal:
Pivot points : price is over resistance 1
Type : Neutral
Timeframe : Weekly
The analysis of the price chart with Central Patterns scanners does not return any result.
No result was found by the Central Candlesticks scanner on Japanese candlesticks.
| S3 | S2 | S1 | Price | R1 | |
|---|---|---|---|---|---|
| ProTrendLines | 1,819.49 | 2,049.28 | 2,561.66 | 2,640.21 | 2,785.43 |
| Change (%) | -31.09% | -22.38% | -2.98% | - | +5.50% |
| Change | -820.72 | -590.93 | -78.55 | - | +145.22 |
| Level | Intermediate | Major | Intermediate | - | Major |
Attention could also be paid to pivot points to set price objectives:
| Pivot points | S3 | S2 | S1 | PP | R1 | R2 | R3 |
|---|---|---|---|---|---|---|---|
| Standard | 2,600.92 | 2,618.82 | 2,629.52 | 2,647.42 | 2,658.12 | 2,676.02 | 2,686.72 |
| Camarilla | 2,632.35 | 2,634.97 | 2,637.59 | 2,640.21 | 2,642.83 | 2,645.45 | 2,648.08 |
| Woodie | 2,597.31 | 2,617.02 | 2,625.91 | 2,645.62 | 2,654.51 | 2,674.22 | 2,683.11 |
| Fibonacci | 2,618.82 | 2,629.75 | 2,636.50 | 2,647.42 | 2,658.35 | 2,665.10 | 2,676.02 |
| Pivot points | S3 | S2 | S1 | PP | R1 | R2 | R3 |
|---|---|---|---|---|---|---|---|
| Standard | 2,573.86 | 2,591.02 | 2,604.86 | 2,622.02 | 2,635.86 | 2,653.02 | 2,666.86 |
| Camarilla | 2,610.19 | 2,613.03 | 2,615.87 | 2,618.71 | 2,621.55 | 2,624.39 | 2,627.24 |
| Woodie | 2,572.21 | 2,590.19 | 2,603.21 | 2,621.19 | 2,634.21 | 2,652.19 | 2,665.21 |
| Fibonacci | 2,591.02 | 2,602.86 | 2,610.18 | 2,622.02 | 2,633.86 | 2,641.18 | 2,653.02 |
| Pivot points | S3 | S2 | S1 | PP | R1 | R2 | R3 |
|---|---|---|---|---|---|---|---|
| Standard | 2,419.53 | 2,501.39 | 2,562.59 | 2,644.45 | 2,705.65 | 2,787.51 | 2,848.71 |
| Camarilla | 2,584.46 | 2,597.57 | 2,610.69 | 2,623.80 | 2,636.91 | 2,650.03 | 2,663.14 |
| Woodie | 2,409.21 | 2,496.23 | 2,552.27 | 2,639.29 | 2,695.33 | 2,782.35 | 2,838.39 |
| Fibonacci | 2,501.39 | 2,556.04 | 2,589.80 | 2,644.45 | 2,699.10 | 2,732.86 | 2,787.51 |
Numerical data
The following is the status of technical indicators and moving averages registered at the time this technical analysis was created:
| RSI (14): | 57.30 | |
| MACD (12,26,9): | 63.3200 | |
| Directional Movement: | 9.90 | |
| AROON (14): | -14.29 | |
| DEMA (21): | 2,700.93 | |
| Parabolic SAR (0,02-0,02-0,2): | 2,727.19 | |
| Elder Ray (13): | -2.28 | |
| Super Trend (3,10): | 2,547.73 | |
| Zig ZAG (10): | 2,640.21 | |
| VORTEX (21): | 1.1400 | |
| Stochastique (14,3,5): | 35.75 | |
| TEMA (21): | 2,675.60 | |
| Williams %R (14): | -59.20 | |
| Chande Momentum Oscillator (20): | -18.03 | |
| Repulse (5,40,3): | -0.2700 | |
| ROCnROLL: | 1 | |
| TRIX (15,9): | 0.5000 | |
| Courbe Coppock: | 3.99 |
| MA7: | 2,629.27 | |
| MA20: | 2,639.20 | |
| MA50: | 2,656.08 | |
| MA100: | 2,625.38 | |
| MAexp7: | 2,639.95 | |
| MAexp20: | 2,604.04 | |
| MAexp50: | 2,445.74 | |
| MAexp100: | 2,265.58 | |
| Price / MA7: | +0.42% | |
| Price / MA20: | +0.04% | |
| Price / MA50: | -0.60% | |
| Price / MA100: | +0.56% | |
| Price / MAexp7: | +0.01% | |
| Price / MAexp20: | +1.39% | |
| Price / MAexp50: | +7.95% | |
| Price / MAexp100: | +16.54% |
News
The latest news and videos published on GOLD - USD at the time of the analysis were as follows:
-
 XAU/USD Price Forecast Today, Technical Analysis (January 03): Gold Tests Resistance Again
-
XAU/USD Weekly Forecast, Technical Analysis (Jan 6 - 10): Gold Bounces for the Week
-
XAU/USD Price Forecast Today, Technical Analysis (January 03): Gold Pulls Back on Friday
-
XAU/USD Price Forecast Today, Technical Analysis (January 02): Gold Rises to Challenge Resistance
-
Gold Price Forecast - Can Gold Shine Again? (January 3, 2025)
About author

Online


Add a comment
Comments
0 comments on the analysis GOLD - USD - Weekly