| Open: | 6.52 |
| Change: | -0.04 |
| Volume: | 151,018 |
| Low: | 6.20 |
| High: | 6.52 |
| High / Low range: | 0.32 |
| Type: | Commodities |
| Ticker: | XAUUSD |
| ISIN: |
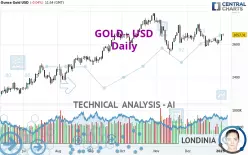
GOLD - USD - Daily - Technical analysis published on 01/03/2025 (GMT)
- 134
- 0
- 01/03/2025 - 11:54
Click here for a new analysis!
- Timeframe : Daily
- - Analysis generated on 01/03/2025 - 11:54
- Status : TARGET REACHED

Summary of the analysis

Additional analysis
Quotes
The GOLD - USD price is 2,657.30 USD. On the day, this instrument lost -0.04% with the lowest point at 2,649.86 USD and the highest point at 2,665.33 USD. The deviation from the price is +0.28% for the low point and -0.30% for the high point.So that you have an overall view of the price change, here is a table showing the variations over several periods:
Near a new HIGH record (5 years)
Type : Bullish
Timeframe : Weekly
Near a new HIGH record (1 year)
Type : Bullish
Timeframe : Weekly
New HIGH record (1st january)
Type : Bullish
Timeframe : Weekly
Near a new HIGH record (1 month)
Type : Bullish
Timeframe : Weekly
Technical
Technical analysis of this Daily chart of GOLD - USD indicates that the overall trend is bullish. The signals returned by the moving averages are 78.57% bullish. This bullish trend is reinforced by the strong signals currently being given by short-term moving averages. An assessment of moving averages reveals several bullish signals that could impact this trend:
Bullish trend reversal : Moving Average 20
Type : Bullish
Timeframe : Daily
Bullish trend reversal : adaptative moving average 20
Type : Bullish
Timeframe : Daily
Bullish trend reversal : adaptative moving average 50
Type : Bullish
Timeframe : Daily
In fact, 11 technical indicators on 18 studied are currently bullish. Caution: the Central Indicators scanner currently detects an excess:
Williams %R indicator is overbought : over -20
Type : Neutral
Timeframe : Daily
Pivot points : price is over resistance 2
Type : Neutral
Timeframe : Weekly
No signals are given by Central Patterns, a market scanner specialised in chart patterns, resistances and supports.
There is also a Japanese candlestick pattern detected by Central Candlesticks that could mark the end of the current short-term trend:
Doji
Type : Neutral
Timeframe : Daily
| S3 | S2 | S1 | Price | R1 | R2 | R3 | |
|---|---|---|---|---|---|---|---|
| ProTrendLines | 2,362.07 | 2,561.66 | 2,633.87 | 2,657.30 | 2,672.68 | 2,718.86 | 2,785.43 |
| Change (%) | -11.11% | -3.60% | -0.88% | - | +0.58% | +2.32% | +4.82% |
| Change | -295.23 | -95.64 | -23.43 | - | +15.38 | +61.56 | +128.13 |
| Level | Minor | Intermediate | Minor | - | Minor | Major | Major |
Attention could also be paid to pivot points to set price objectives:
| Pivot points | S3 | S2 | S1 | PP | R1 | R2 | R3 |
|---|---|---|---|---|---|---|---|
| Standard | 2,596.27 | 2,609.56 | 2,634.02 | 2,647.31 | 2,671.77 | 2,685.06 | 2,709.52 |
| Camarilla | 2,648.10 | 2,651.56 | 2,655.02 | 2,658.48 | 2,661.94 | 2,665.40 | 2,668.86 |
| Woodie | 2,601.86 | 2,612.35 | 2,639.61 | 2,650.10 | 2,677.36 | 2,687.85 | 2,715.11 |
| Fibonacci | 2,609.56 | 2,623.98 | 2,632.89 | 2,647.31 | 2,661.73 | 2,670.64 | 2,685.06 |
| Pivot points | S3 | S2 | S1 | PP | R1 | R2 | R3 |
|---|---|---|---|---|---|---|---|
| Standard | 2,573.86 | 2,591.02 | 2,604.86 | 2,622.02 | 2,635.86 | 2,653.02 | 2,666.86 |
| Camarilla | 2,610.19 | 2,613.03 | 2,615.87 | 2,618.71 | 2,621.55 | 2,624.39 | 2,627.24 |
| Woodie | 2,572.21 | 2,590.19 | 2,603.21 | 2,621.19 | 2,634.21 | 2,652.19 | 2,665.21 |
| Fibonacci | 2,591.02 | 2,602.86 | 2,610.18 | 2,622.02 | 2,633.86 | 2,641.18 | 2,653.02 |
| Pivot points | S3 | S2 | S1 | PP | R1 | R2 | R3 |
|---|---|---|---|---|---|---|---|
| Standard | 2,419.53 | 2,501.39 | 2,562.59 | 2,644.45 | 2,705.65 | 2,787.51 | 2,848.71 |
| Camarilla | 2,584.46 | 2,597.57 | 2,610.69 | 2,623.80 | 2,636.91 | 2,650.03 | 2,663.14 |
| Woodie | 2,409.21 | 2,496.23 | 2,552.27 | 2,639.29 | 2,695.33 | 2,782.35 | 2,838.39 |
| Fibonacci | 2,501.39 | 2,556.04 | 2,589.80 | 2,644.45 | 2,699.10 | 2,732.86 | 2,787.51 |
Numerical data
The following is the status of the technical indicators and moving averages at the time of publication of this technical analysis:
| RSI (14): | 54.44 | |
| MACD (12,26,9): | -3.8300 | |
| Directional Movement: | 3.40 | |
| AROON (14): | -21.43 | |
| DEMA (21): | 2,629.97 | |
| Parabolic SAR (0,02-0,02-0,2): | 2,697.79 | |
| Elder Ray (13): | 22.81 | |
| Super Trend (3,10): | 2,581.02 | |
| Zig ZAG (10): | 2,657.51 | |
| VORTEX (21): | 1.0200 | |
| Stochastique (14,3,5): | 62.45 | |
| TEMA (21): | 2,630.38 | |
| Williams %R (14): | -9.75 | |
| Chande Momentum Oscillator (20): | 9.80 | |
| Repulse (5,40,3): | 1.1300 | |
| ROCnROLL: | 1 | |
| TRIX (15,9): | -0.0400 | |
| Courbe Coppock: | 2.02 |
| MA7: | 2,631.66 | |
| MA20: | 2,640.11 | |
| MA50: | 2,656.45 | |
| MA100: | 2,625.57 | |
| MAexp7: | 2,637.28 | |
| MAexp20: | 2,636.65 | |
| MAexp50: | 2,638.41 | |
| MAexp100: | 2,597.61 | |
| Price / MA7: | +0.97% | |
| Price / MA20: | +0.65% | |
| Price / MA50: | +0.03% | |
| Price / MA100: | +1.21% | |
| Price / MAexp7: | +0.76% | |
| Price / MAexp20: | +0.78% | |
| Price / MAexp50: | +0.72% | |
| Price / MAexp100: | +2.30% |
News
Don't forget to follow the news on GOLD - USD. At the time of publication of this analysis, the latest news was as follows:
-
01/02/2025 - 22:02
 XAU/USD Price Forecast Today, Technical Analysis (January 02): Gold Rises to Challenge Resistance
-
01/02/2025 - 16:14
Gold Price Forecast - Can Gold Shine Again? (January 3, 2025)
-
01/02/2025 - 14:37
XAU/USD Price Forecast Today, Technical Analysis (January 02): Gold Rallies a Bit on Thursday
-
01/01/2025 - 13:29
Gold and Silver Price Forecast 2025: Q1 Outlook & Trends | What’s Next for #XAUUSD & #XAGUSD?
-
12/31/2024 - 21:35
XAU/USD Price Forecast Today, Technical Analysis (December 31): Gold Remains Stuck
About author

Online


Add a comment
Comments
0 comments on the analysis GOLD - USD - Daily