| Open: | 5.90 |
| Change: | -0.15 |
| Volume: | 9,957 |
| Low: | 5.60 |
| High: | 5.90 |
| High / Low range: | 0.30 |
| Type: | Commodities |
| Ticker: | XAUUSD |
| ISIN: |
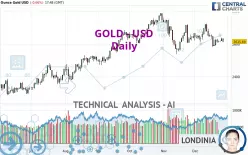
GOLD - USD - Daily - Technical analysis published on 12/27/2024 (GMT)
- 168
- 0
- 12/27/2024 - 17:48
Click here for a new analysis!
- Timeframe : Daily
- - Analysis generated on 12/27/2024 - 17:48
- Status : INVALID

Summary of the analysis

Additional analysis
Quotes
The GOLD - USD rating is 2,615.66 USD. The price registered a decrease of -0.66% on the session and was traded between 2,611.63 USD and 2,638.39 USD over the period. The price is currently at +0.15% from its lowest and -0.86% from its highest.A bearish opening was detected by the Central Gaps scanner. Sellers are trying to impose a bearish trend in the very short term.
Bearish opening
Type : Bearish
Timeframe : Openning
So that you have an overall view of the price change, here is a table showing the variations over several periods:
New LOW record (1st january)
Type : Bearish
Timeframe : Weekly
Near a new HIGH record (1 month)
Type : Bullish
Timeframe : Weekly
Technical
Technical analysis of this Daily chart of GOLD - USD indicates that the overall trend is slightly bearish. Only 53.57% of the signals given by moving averages are bearish. This slightly bearish trend is reinforced by the strong signals currently being given by short-term moving averages. The Central Indicators scanner detects a bearish signal on moving averages that could impact this trend:
Bearish price crossover with Moving Average 100
Type : Bearish
Timeframe : Daily
The probability of a further decline is low given the direction of the technical indicators.
Central Indicators, the scanner specialised in technical indicators, has identified these signals:
Pivot points : price is under support 1
Type : Neutral
Timeframe : Daily
Price is back under the pivot point
Type : Bearish
Timeframe : Weekly
Central Patterns, the scanner specializing in chart patterns, did not identify any signals.
No result was found by the Central Candlesticks scanner on Japanese candlesticks.
| S3 | S2 | S1 | Price | R1 | R2 | R3 | |
|---|---|---|---|---|---|---|---|
| ProTrendLines | 2,362.07 | 2,426.21 | 2,561.66 | 2,615.66 | 2,634.45 | 2,672.68 | 2,718.86 |
| Change (%) | -9.70% | -7.24% | -2.06% | - | +0.72% | +2.18% | +3.95% |
| Change | -253.59 | -189.45 | -54.00 | - | +18.79 | +57.02 | +103.20 |
| Level | Minor | Minor | Intermediate | - | Intermediate | Minor | Major |
Attention could also be paid to pivot points to set price objectives:
| Pivot points | S3 | S2 | S1 | PP | R1 | R2 | R3 |
|---|---|---|---|---|---|---|---|
| Standard | 2,578.65 | 2,595.14 | 2,605.41 | 2,621.90 | 2,632.17 | 2,648.66 | 2,658.93 |
| Camarilla | 2,608.32 | 2,610.77 | 2,613.23 | 2,615.68 | 2,618.13 | 2,620.59 | 2,623.04 |
| Woodie | 2,575.54 | 2,593.59 | 2,602.30 | 2,620.35 | 2,629.06 | 2,647.11 | 2,655.82 |
| Fibonacci | 2,595.14 | 2,605.36 | 2,611.68 | 2,621.90 | 2,632.12 | 2,638.44 | 2,648.66 |
| Pivot points | S3 | S2 | S1 | PP | R1 | R2 | R3 |
|---|---|---|---|---|---|---|---|
| Standard | 2,571.84 | 2,590.01 | 2,602.84 | 2,621.01 | 2,633.84 | 2,652.01 | 2,664.84 |
| Camarilla | 2,607.16 | 2,610.00 | 2,612.84 | 2,615.68 | 2,618.52 | 2,621.36 | 2,624.21 |
| Woodie | 2,569.18 | 2,588.68 | 2,600.18 | 2,619.68 | 2,631.18 | 2,650.68 | 2,662.18 |
| Fibonacci | 2,590.01 | 2,601.85 | 2,609.17 | 2,621.01 | 2,632.85 | 2,640.17 | 2,652.01 |
| Pivot points | S3 | S2 | S1 | PP | R1 | R2 | R3 |
|---|---|---|---|---|---|---|---|
| Standard | 2,311.93 | 2,424.40 | 2,537.33 | 2,649.80 | 2,762.73 | 2,875.20 | 2,988.13 |
| Camarilla | 2,588.28 | 2,608.94 | 2,629.60 | 2,650.26 | 2,670.92 | 2,691.58 | 2,712.25 |
| Woodie | 2,312.16 | 2,424.52 | 2,537.56 | 2,649.92 | 2,762.96 | 2,875.32 | 2,988.36 |
| Fibonacci | 2,424.40 | 2,510.50 | 2,563.70 | 2,649.80 | 2,735.90 | 2,789.10 | 2,875.20 |
Numerical data
The following is the status of the technical indicators and moving averages at the time of publication of this technical analysis:
| RSI (14): | 45.23 | |
| MACD (12,26,9): | -10.1600 | |
| Directional Movement: | -3.35 | |
| AROON (14): | -28.57 | |
| DEMA (21): | 2,622.06 | |
| Parabolic SAR (0,02-0,02-0,2): | 2,707.43 | |
| Elder Ray (13): | -3.78 | |
| Super Trend (3,10): | 2,581.02 | |
| Zig ZAG (10): | 2,615.79 | |
| VORTEX (21): | 0.9900 | |
| Stochastique (14,3,5): | 27.45 | |
| TEMA (21): | 2,615.26 | |
| Williams %R (14): | -77.04 | |
| Chande Momentum Oscillator (20): | -103.97 | |
| Repulse (5,40,3): | -0.6100 | |
| ROCnROLL: | 2 | |
| TRIX (15,9): | -0.0400 | |
| Courbe Coppock: | 2.94 |
| MA7: | 2,616.64 | |
| MA20: | 2,640.80 | |
| MA50: | 2,663.80 | |
| MA100: | 2,618.48 | |
| MAexp7: | 2,622.46 | |
| MAexp20: | 2,634.45 | |
| MAexp50: | 2,638.15 | |
| MAexp100: | 2,594.15 | |
| Price / MA7: | -0.04% | |
| Price / MA20: | -0.95% | |
| Price / MA50: | -1.81% | |
| Price / MA100: | -0.11% | |
| Price / MAexp7: | -0.26% | |
| Price / MAexp20: | -0.71% | |
| Price / MAexp50: | -0.85% | |
| Price / MAexp100: | +0.83% |
News
The last news published on GOLD - USD at the time of the generation of this analysis was as follows:
-
12/27/2024 - 15:55
 XAU/USD Weekly Forecast, Technical Analysis (Dec 30 - Jan 3): Gold Has a Tough Week
-
12/27/2024 - 14:54
XAU/USD Price Forecast Today, Technical Analysis (December 27): Gold Falls Again on Friday
-
12/26/2024 - 21:20
XAU/USD Price Forecast Today, Technical Analysis (December 26): Gold Advances to a Five-day High
-
12/26/2024 - 15:27
Gold (XAU/USD) Daily Price Forecast and Technical Analysis, December 26, 2024, #gold #xauusd #xau
-
12/26/2024 - 15:01
XAU/USD Price Forecast Today, Technical Analysis (December 26): Gold Rallies a Bit on Thursday
About author

Online


Add a comment
Comments
0 comments on the analysis GOLD - USD - Daily