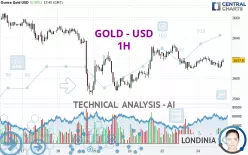
GOLD - USD - 1H - Technical analysis published on 12/24/2024 (GMT)
- 166
- 0
- Timeframe : 1H
- - Analysis generated on
- Status : NEUTRAL

Summary of the analysis

Additional analysis
Quotes
The GOLD - USD price is 2,617.81 USD. On the day, this instrument gained +0.09% and was traded between 2,610.04 USD and 2,621.56 USD over the period. The price is currently at +0.30% from its lowest and -0.14% from its highest.A bearish opening was detected by the Central Gaps scanner. Sellers are trying to impose a bearish trend in the very short term.
Bearish opening
Type : Bearish
Timeframe : Openning
So that you have an overall view of the price change, here is a table showing the variations over several periods:
Near a new HIGH record (1 month)
Type : Bullish
Timeframe : Weekly
Technical
Technical analysis of GOLD - USD in 1H shows a neutral overall trend. This indecision could turn into a bullish trend due to the slightly bullish signals currently given by short-term moving averages. The Central Indicators market scanner is currently detecting a bullish signal that could impact this trend:
Bullish trend reversal : adaptative moving average 20
Type : Bullish
Timeframe : 1 hour
In fact, only 8 technical indicators out of 18 studied are currently positioned bullish. Central Indicators, the detector scanner for these technical indicators has recently detected several signals:
MACD crosses UP its Moving Average
Type : Bullish
Timeframe : 1 hour
Parabolic SAR indicator bullish reversal
Type : Bullish
Timeframe : 1 hour
Price is back over the pivot point
Type : Bullish
Timeframe : 1 hour
Price is back under the pivot point
Type : Bearish
Timeframe : Weekly
Williams %R indicator is back under -50
Type : Bearish
Timeframe : 1 hour
Central Patterns, the scanner specializing in chart patterns, did not identify any signals.
The Central Candlesticks scanner, specialised in Japanese candlesticks, did not identify any signals.
| S3 | S2 | S1 | Price | R1 | R2 | R3 | |
|---|---|---|---|---|---|---|---|
| ProTrendLines | 2,561.66 | 2,583.24 | 2,608.10 | 2,617.81 | 2,634.20 | 2,672.68 | 2,700.25 |
| Change (%) | -2.14% | -1.32% | -0.37% | - | +0.63% | +2.10% | +3.15% |
| Change | -56.15 | -34.57 | -9.71 | - | +16.39 | +54.87 | +82.44 |
| Level | Intermediate | Minor | Intermediate | - | Intermediate | Intermediate | Minor |
Pivot points can also be used to set your price objectives. Here is the price situation in relation to pivot points:
| Pivot points | S3 | S2 | S1 | PP | R1 | R2 | R3 |
|---|---|---|---|---|---|---|---|
| Standard | 2,579.52 | 2,593.85 | 2,604.71 | 2,619.04 | 2,629.90 | 2,644.23 | 2,655.09 |
| Camarilla | 2,608.65 | 2,610.96 | 2,613.27 | 2,615.58 | 2,617.89 | 2,620.20 | 2,622.51 |
| Woodie | 2,577.80 | 2,592.98 | 2,602.99 | 2,618.17 | 2,628.18 | 2,643.36 | 2,653.37 |
| Fibonacci | 2,593.85 | 2,603.47 | 2,609.41 | 2,619.04 | 2,628.66 | 2,634.60 | 2,644.23 |
| Pivot points | S3 | S2 | S1 | PP | R1 | R2 | R3 |
|---|---|---|---|---|---|---|---|
| Standard | 2,501.67 | 2,542.45 | 2,582.90 | 2,623.68 | 2,664.13 | 2,704.91 | 2,745.36 |
| Camarilla | 2,601.00 | 2,608.45 | 2,615.89 | 2,623.34 | 2,630.79 | 2,638.23 | 2,645.68 |
| Woodie | 2,501.50 | 2,542.37 | 2,582.73 | 2,623.60 | 2,663.96 | 2,704.83 | 2,745.19 |
| Fibonacci | 2,542.45 | 2,573.48 | 2,592.65 | 2,623.68 | 2,654.71 | 2,673.88 | 2,704.91 |
| Pivot points | S3 | S2 | S1 | PP | R1 | R2 | R3 |
|---|---|---|---|---|---|---|---|
| Standard | 2,311.93 | 2,424.40 | 2,537.33 | 2,649.80 | 2,762.73 | 2,875.20 | 2,988.13 |
| Camarilla | 2,588.28 | 2,608.94 | 2,629.60 | 2,650.26 | 2,670.92 | 2,691.58 | 2,712.25 |
| Woodie | 2,312.16 | 2,424.52 | 2,537.56 | 2,649.92 | 2,762.96 | 2,875.32 | 2,988.36 |
| Fibonacci | 2,424.40 | 2,510.50 | 2,563.70 | 2,649.80 | 2,735.90 | 2,789.10 | 2,875.20 |
Numerical data
The following is the status of the technical indicators and moving averages at the time of publication of this technical analysis:
| RSI (14): | 53.97 | |
| MACD (12,26,9): | -0.6000 | |
| Directional Movement: | 7.57 | |
| AROON (14): | -57.14 | |
| DEMA (21): | 2,614.87 | |
| Parabolic SAR (0,02-0,02-0,2): | 2,610.04 | |
| Elder Ray (13): | 2.05 | |
| Super Trend (3,10): | 2,624.71 | |
| Zig ZAG (10): | 2,617.97 | |
| VORTEX (21): | 1.0700 | |
| Stochastique (14,3,5): | 45.95 | |
| TEMA (21): | 2,614.33 | |
| Williams %R (14): | -27.52 | |
| Chande Momentum Oscillator (20): | -0.97 | |
| Repulse (5,40,3): | 0.1600 | |
| ROCnROLL: | 1 | |
| TRIX (15,9): | 0.0000 | |
| Courbe Coppock: | 0.17 |
| MA7: | 2,619.70 | |
| MA20: | 2,643.79 | |
| MA50: | 2,668.26 | |
| MA100: | 2,612.21 | |
| MAexp7: | 2,615.15 | |
| MAexp20: | 2,615.67 | |
| MAexp50: | 2,616.29 | |
| MAexp100: | 2,620.94 | |
| Price / MA7: | -0.07% | |
| Price / MA20: | -0.98% | |
| Price / MA50: | -1.89% | |
| Price / MA100: | +0.21% | |
| Price / MAexp7: | +0.10% | |
| Price / MAexp20: | +0.08% | |
| Price / MAexp50: | +0.06% | |
| Price / MAexp100: | -0.12% |
News
The latest news and videos published on GOLD - USD at the time of the analysis were as follows:
-
 XAU/USD Price Forecast Today, Technical Analysis (December 24): Gold is Fairly Stagnant on Tuesday
-
XAU/USD Price Forecast Today, Technical Analysis (December 23): Gold Rallies Early but Gives Gains
-
XAU/USD Price Forecast Today, Technical Analysis (December 20): Gold Bounces on Friday
-
XAU/USD Weekly Forecast, Technical Analysis (Dec 23-27): Gold Plunges but Sees Buyers on Friday
-
XAU/USD Price Forecast Today, Technical Analysis (December 20): Gold Rallies on Friday
About author

Online


Add a comment
Comments
0 comments on the analysis GOLD - USD - 1H