| Open: | 1.2965 |
| Change: | -0.0054 |
| Volume: | 136,292 |
| Low: | 1.2888 |
| High: | 1.2970 |
| High / Low range: | 0.0082 |
| Type: | Commodities |
| Ticker: | XAUUSD |
| ISIN: |
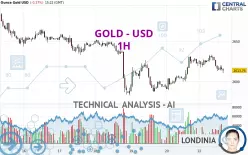
GOLD - USD - 1H - Technical analysis published on 12/23/2024 (GMT)
- 243
- 0
- 12/23/2024 - 15:22
- Who voted?
Click here for a new analysis!
- Timeframe : 1H
- - Analysis generated on 12/23/2024 - 15:22
- Status : LEVEL MAINTAINED

Summary of the analysis

Additional analysis
Quotes
The GOLD - USD price is 2,613.74 USD. On the day, this instrument lost -0.37% and was between 2,610.54 USD and 2,633.36 USD. This implies that the price is at +0.12% from its lowest and at -0.75% from its highest.The Central Gaps scanner detects a bullish opening. A small advantage for buyers in the very short term.
Bullish opening
Type : Bullish
Timeframe : Openning
A study of price movements over other periods shows the following variations:
Near a new HIGH record (1 month)
Type : Bullish
Timeframe : Weekly
Technical
Technical analysis of this 1H chart of GOLD - USD indicates that the overall trend is bearish. 67.86% of the signals given by moving averages are bearish. This bearish trend is slowing down slightly given the slightly bearish signals given by short-term moving averages. An assessment of moving averages reveals a bearish signal that could impact this trend:
Bearish price crossover with adaptative moving average 100
Type : Bearish
Timeframe : 1 hour
Technical indicators are slightly bearish. There is therefore considerable uncertainty about the continuation of the decline.
But beware of excesses. The Central Indicators scanner currently detects this:
CCI indicator is oversold : under -100
Type : Neutral
Timeframe : 1 hour
RSI indicator: bullish divergence
Type : Bullish
Timeframe : 1 hour
Williams %R indicator is oversold : under -80
Type : Neutral
Timeframe : 1 hour
Price is back under the pivot point
Type : Bearish
Timeframe : 1 hour
Price is back under the pivot point
Type : Bearish
Timeframe : Weekly
Central Patterns, the scanner specializing in chart patterns, did not identify any signals.
The Central Candlesticks scanner, specialised in Japanese candlesticks, did not identify any signals.
| S3 | S2 | S1 | Price | R1 | R2 | R3 | |
|---|---|---|---|---|---|---|---|
| ProTrendLines | 2,561.66 | 2,583.24 | 2,600.26 | 2,613.74 | 2,618.19 | 2,634.20 | 2,672.68 |
| Change (%) | -1.99% | -1.17% | -0.52% | - | +0.17% | +0.78% | +2.26% |
| Change | -52.08 | -30.50 | -13.48 | - | +4.45 | +20.46 | +58.94 |
| Level | Intermediate | Intermediate | Major | - | Minor | Intermediate | Intermediate |
Pivot points can also be used to set your price objectives. Here is the price situation in relation to pivot points:
| Pivot points | S3 | S2 | S1 | PP | R1 | R2 | R3 |
|---|---|---|---|---|---|---|---|
| Standard | 2,555.69 | 2,572.67 | 2,598.01 | 2,614.99 | 2,640.33 | 2,657.31 | 2,682.65 |
| Camarilla | 2,611.70 | 2,615.58 | 2,619.46 | 2,623.34 | 2,627.22 | 2,631.10 | 2,634.98 |
| Woodie | 2,559.86 | 2,574.76 | 2,602.18 | 2,617.08 | 2,644.50 | 2,659.40 | 2,686.82 |
| Fibonacci | 2,572.67 | 2,588.84 | 2,598.83 | 2,614.99 | 2,631.16 | 2,641.15 | 2,657.31 |
| Pivot points | S3 | S2 | S1 | PP | R1 | R2 | R3 |
|---|---|---|---|---|---|---|---|
| Standard | 2,501.67 | 2,542.45 | 2,582.90 | 2,623.68 | 2,664.13 | 2,704.91 | 2,745.36 |
| Camarilla | 2,601.00 | 2,608.45 | 2,615.89 | 2,623.34 | 2,630.79 | 2,638.23 | 2,645.68 |
| Woodie | 2,501.50 | 2,542.37 | 2,582.73 | 2,623.60 | 2,663.96 | 2,704.83 | 2,745.19 |
| Fibonacci | 2,542.45 | 2,573.48 | 2,592.65 | 2,623.68 | 2,654.71 | 2,673.88 | 2,704.91 |
| Pivot points | S3 | S2 | S1 | PP | R1 | R2 | R3 |
|---|---|---|---|---|---|---|---|
| Standard | 2,311.93 | 2,424.40 | 2,537.33 | 2,649.80 | 2,762.73 | 2,875.20 | 2,988.13 |
| Camarilla | 2,588.28 | 2,608.94 | 2,629.60 | 2,650.26 | 2,670.92 | 2,691.58 | 2,712.25 |
| Woodie | 2,312.16 | 2,424.52 | 2,537.56 | 2,649.92 | 2,762.96 | 2,875.32 | 2,988.36 |
| Fibonacci | 2,424.40 | 2,510.50 | 2,563.70 | 2,649.80 | 2,735.90 | 2,789.10 | 2,875.20 |
Numerical data
The following are the details of the technical indicators and moving averages that were collected to generate this technical analysis:
| RSI (14): | 49.25 | |
| MACD (12,26,9): | 1.7900 | |
| Directional Movement: | -3.71 | |
| AROON (14): | -28.57 | |
| DEMA (21): | 2,624.52 | |
| Parabolic SAR (0,02-0,02-0,2): | 2,631.51 | |
| Elder Ray (13): | -4.92 | |
| Super Trend (3,10): | 2,614.04 | |
| Zig ZAG (10): | 2,618.82 | |
| VORTEX (21): | 0.9800 | |
| Stochastique (14,3,5): | 18.73 | |
| TEMA (21): | 2,623.47 | |
| Williams %R (14): | -73.63 | |
| Chande Momentum Oscillator (20): | -2.07 | |
| Repulse (5,40,3): | -0.0200 | |
| ROCnROLL: | -1 | |
| TRIX (15,9): | 0.0200 | |
| Courbe Coppock: | 0.19 |
| MA7: | 2,624.80 | |
| MA20: | 2,644.70 | |
| MA50: | 2,669.19 | |
| MA100: | 2,609.91 | |
| MAexp7: | 2,620.55 | |
| MAexp20: | 2,621.19 | |
| MAexp50: | 2,618.41 | |
| MAexp100: | 2,624.24 | |
| Price / MA7: | -0.42% | |
| Price / MA20: | -1.17% | |
| Price / MA50: | -2.08% | |
| Price / MA100: | +0.15% | |
| Price / MAexp7: | -0.26% | |
| Price / MAexp20: | -0.28% | |
| Price / MAexp50: | -0.18% | |
| Price / MAexp100: | -0.40% |
News
The last news published on GOLD - USD at the time of the generation of this analysis was as follows:
-
12/20/2024 - 21:34
 XAU/USD Price Forecast Today, Technical Analysis (December 20): Gold Bounces on Friday
-
12/20/2024 - 17:16
XAU/USD Weekly Forecast, Technical Analysis (Dec 23-27): Gold Plunges but Sees Buyers on Friday
-
12/20/2024 - 16:41
XAU/USD Price Forecast Today, Technical Analysis (December 20): Gold Rallies on Friday
-
12/19/2024 - 21:34
XAU/USD Price Forecast Today, Technical Analysis (December 19): Gold's Bearish Correction Deepens
-
12/19/2024 - 15:37
Gold (XAU/USD) Daily Price Forecast and Technical Analysis, December 19, 2024, #trading #gold #xau
About author

Online


Add a comment
Comments
0 comments on the analysis GOLD - USD - 1H