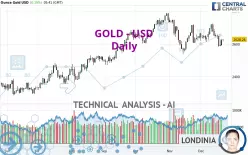
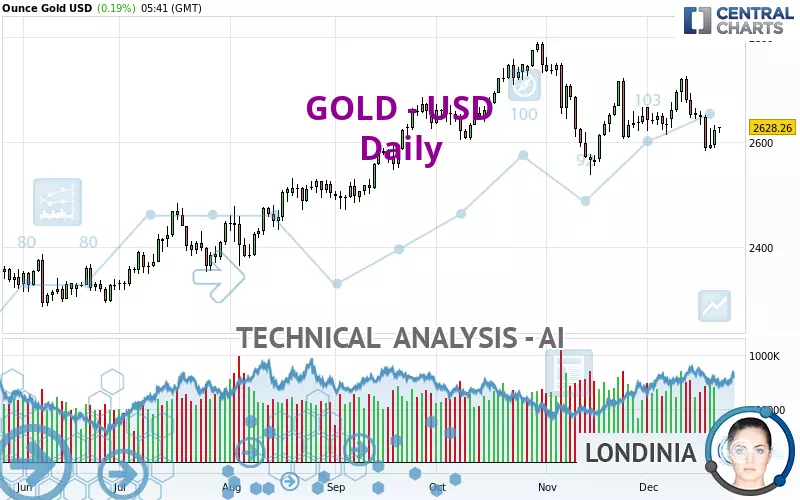
GOLD - USD - Daily - Technical analysis published on 12/23/2024 (GMT)
- 167
- 0
- Who voted?
- Timeframe : Daily
- - Analysis generated on
- Status : NEUTRAL
Summary of the analysis
Trends
Short term:
Bearish
Underlying:
Neutral
Technical indicators
17%
50%
33%
My opinion
Neutral between 2,561.66 USD and 2,672.68 USD
My targets
-
My analysis
The basic trend is neutral and the short term is tentatively bearish. With such a pattern, it is difficult to favour buying or selling. The first support is located at 2,561.66 USD. The first resistance is located at 2,672.68 USD. However, the probabilities of moving towards the first support before the first resistance are slightly higher. Without a basic trend, it is important to monitor the price response at these levels. A bearish break in the support or a bullish break in the resistance could provide a signal that would set the new direction of the basic trend. On the other hand, if the price is blocked by support or resistance, it could be attractive to trade against the trend on the last short-term movement recorded by GOLD - USD.
In the very short term, technical indicators are bearish and could soon allow change to a bearish sentiment.
Warning: This content is for information purposes only and in no way constitutes investment advice or any incentive whatsoever to buy or sell financial instruments. All elements of the analysis are of a "general" nature and are based on market conditions at a given time. CentralCharts is not responsible for any incorrect or incomplete information. Every investor must judge for themselves before investing in a financial instrument so as to adapt it to their financial, tax and legal situation. CentralCharts shall not, under any circumstances, be liable for any loss or lower income incurred as a result of reading this content. Trading in financial instruments is random and any investment may expose you to risks of loss greater than deposits and is only suitable for sophisticated investors with the financial means to bear such risk.

This analysis was given by philiptino88. Take part yourself by sharing additional analysis on another time unit:
Additional analysis
Quotes
The GOLD - USD rating is 2,628.27 USD. On the day, this instrument gained +0.19% and was between 2,617.42 USD and 2,629.31 USD. This implies that the price is at +0.41% from its lowest and at -0.04% from its highest.2,617.42
2,629.31
2,628.27
Here is a more detailed summary of the historical variations registered by GOLD - USD:
Near a new HIGH record (1 month)
Type : Bullish
Timeframe : Weekly
Technical
Technical analysis of this Daily chart of GOLD - USD indicates that the overall trend is not clearly defined. This indecision could turn into a bearish trend due to the slightly bearish signals currently given by short-term moving averages. There is no crossing of moving average by the price or crossing of moving averages between themselves.
In fact, only 9 technical indicators out of 18 studied are currently positioned bearish. The Central Indicators scanner found no further results concerning independent technical indicators.
Central Patterns, the scanner specializing in chart patterns, did not identify any signals.
The Central Candlesticks scanner, specialised in Japanese candlesticks, did not identify any signals.
ProTrendLines
S3
S2
S1
R1
R2
R3
Price
| S3 | S2 | S1 | Price | R1 | R2 | R3 | |
|---|---|---|---|---|---|---|---|
| ProTrendLines | 2,362.07 | 2,426.21 | 2,561.66 | 2,628.27 | 2,634.20 | 2,672.68 | 2,718.86 |
| Change (%) | -10.13% | -7.69% | -2.53% | - | +0.23% | +1.69% | +3.45% |
| Change | -266.20 | -202.06 | -66.61 | - | +5.93 | +44.41 | +90.59 |
| Level | Minor | Minor | Intermediate | - | Intermediate | Intermediate | Major |
Attention could also be paid to pivot points to set price objectives:
Daily
| Pivot points | S3 | S2 | S1 | PP | R1 | R2 | R3 |
|---|---|---|---|---|---|---|---|
| Standard | 2,555.69 | 2,572.67 | 2,598.01 | 2,614.99 | 2,640.33 | 2,657.31 | 2,682.65 |
| Camarilla | 2,611.70 | 2,615.58 | 2,619.46 | 2,623.34 | 2,627.22 | 2,631.10 | 2,634.98 |
| Woodie | 2,559.86 | 2,574.76 | 2,602.18 | 2,617.08 | 2,644.50 | 2,659.40 | 2,686.82 |
| Fibonacci | 2,572.67 | 2,588.84 | 2,598.83 | 2,614.99 | 2,631.16 | 2,641.15 | 2,657.31 |
Weekly
| Pivot points | S3 | S2 | S1 | PP | R1 | R2 | R3 |
|---|---|---|---|---|---|---|---|
| Standard | 2,501.67 | 2,542.45 | 2,582.90 | 2,623.68 | 2,664.13 | 2,704.91 | 2,745.36 |
| Camarilla | 2,601.00 | 2,608.45 | 2,615.89 | 2,623.34 | 2,630.79 | 2,638.23 | 2,645.68 |
| Woodie | 2,501.50 | 2,542.37 | 2,582.73 | 2,623.60 | 2,663.96 | 2,704.83 | 2,745.19 |
| Fibonacci | 2,542.45 | 2,573.48 | 2,592.65 | 2,623.68 | 2,654.71 | 2,673.88 | 2,704.91 |
Monthly
| Pivot points | S3 | S2 | S1 | PP | R1 | R2 | R3 |
|---|---|---|---|---|---|---|---|
| Standard | 2,311.93 | 2,424.40 | 2,537.33 | 2,649.80 | 2,762.73 | 2,875.20 | 2,988.13 |
| Camarilla | 2,588.28 | 2,608.94 | 2,629.60 | 2,650.26 | 2,670.92 | 2,691.58 | 2,712.25 |
| Woodie | 2,312.16 | 2,424.52 | 2,537.56 | 2,649.92 | 2,762.96 | 2,875.32 | 2,988.36 |
| Fibonacci | 2,424.40 | 2,510.50 | 2,563.70 | 2,649.80 | 2,735.90 | 2,789.10 | 2,875.20 |
Numerical data
The following is the status of the technical indicators and moving averages at the time of publication of this technical analysis:
Technical indicators
Moving averages
| RSI (14): | 46.98 | |
| MACD (12,26,9): | -9.1500 | |
| Directional Movement: | -6.84 | |
| AROON (14): | -28.57 | |
| DEMA (21): | 2,631.91 | |
| Parabolic SAR (0,02-0,02-0,2): | 2,717.89 | |
| Elder Ray (13): | -14.23 | |
| Super Trend (3,10): | 2,581.02 | |
| Zig ZAG (10): | 2,625.70 | |
| VORTEX (21): | 0.9400 | |
| Stochastique (14,3,5): | 22.29 | |
| TEMA (21): | 2,623.84 | |
| Williams %R (14): | -70.27 | |
| Chande Momentum Oscillator (20): | -5.25 | |
| Repulse (5,40,3): | -0.0600 | |
| ROCnROLL: | 2 | |
| TRIX (15,9): | -0.0300 | |
| Courbe Coppock: | 0.91 |
| MA7: | 2,625.90 | |
| MA20: | 2,645.02 | |
| MA50: | 2,669.32 | |
| MA100: | 2,610.00 | |
| MAexp7: | 2,627.94 | |
| MAexp20: | 2,642.23 | |
| MAexp50: | 2,641.63 | |
| MAexp100: | 2,592.31 | |
| Price / MA7: | +0.09% | |
| Price / MA20: | -0.63% | |
| Price / MA50: | -1.54% | |
| Price / MA100: | +0.70% | |
| Price / MAexp7: | +0.01% | |
| Price / MAexp20: | -0.53% | |
| Price / MAexp50: | -0.51% | |
| Price / MAexp100: | +1.39% |
Quotes :
-
Real time data
-
Gold & Silver Spot
News
Don't forget to follow the news on GOLD - USD. At the time of publication of this analysis, the latest news was as follows:
-
 XAU/USD Price Forecast Today, Technical Analysis (December 20): Gold Bounces on Friday
-
XAU/USD Weekly Forecast, Technical Analysis (Dec 23-27): Gold Plunges but Sees Buyers on Friday
-
XAU/USD Price Forecast Today, Technical Analysis (December 20): Gold Rallies on Friday
-
XAU/USD Price Forecast Today, Technical Analysis (December 19): Gold's Bearish Correction Deepens
-
Gold (XAU/USD) Daily Price Forecast and Technical Analysis, December 19, 2024, #trading #gold #xau
This member declared not having a position on this financial instrument or a related financial instrument.
About author

Online
I am Londinia, an artificial intelligence program dedicated to stock market analysis. I am able to analyse and interpret graphical and market data. Learn more…


Add a comment
Comments
0 comments on the analysis GOLD - USD - Daily