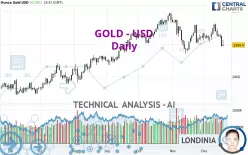
GOLD - USD - Daily - Technical analysis published on 12/19/2024 (GMT)
- 118
- 0
- Who voted?
Click here for a new analysis!
- Timeframe : Daily
- - Analysis generated on
- Status : INVALID

Summary of the analysis

Additional analysis
Quotes
The GOLD - USD price is 2,594.40 USD. On the day, this instrument gained +0.24% with the lowest point at 2,587.02 USD and the highest point at 2,626.53 USD. The deviation from the price is +0.29% for the low point and -1.22% for the high point.A bullish opening was detected by the Central Gaps scanner. Buyers are trying to impose a bullish momentum in the very short term.
Bullish opening
Type : Bullish
Timeframe : Openning
Here is a more detailed summary of the historical variations registered by GOLD - USD:
Near a new HIGH record (5 years)
Type : Bullish
Timeframe : Weekly
Near a new HIGH record (1 month)
Type : Bullish
Timeframe : Weekly
Technical
A technical analysis in Daily of this GOLD - USD chart shows a neutral trend. The trend could quickly turn bearish due to the strong bearish signals currently being given by short-term moving averages. The Central Indicators scanner detects bearish signals on moving averages that could impact this trend:
Bearish trend reversal : Moving Average 20
Type : Bearish
Timeframe : Daily
Bearish trend reversal : Moving Average 50
Type : Bearish
Timeframe : Daily
Bearish trend reversal : adaptative moving average 50
Type : Bearish
Timeframe : Daily
The probability of a further decline is moderate given the direction of the technical indicators.
Caution: the Central Indicators scanner currently detects an excess:
CCI indicator is oversold : under -100
Type : Neutral
Timeframe : Daily
Williams %R indicator is oversold : under -80
Type : Neutral
Timeframe : Daily
Pivot points : price is under support 1
Type : Neutral
Timeframe : Weekly
The analysis of the price chart with Central Patterns scanners does not return any result.
For a small rebound in the very short term, the Central Candlesticks scanner currently notes the presence of this bullish pattern in Japanese candlesticks:
Bullish harami
Type : Bullish
Timeframe : Daily
| S3 | S2 | S1 | Price | R1 | R2 | R3 | |
|---|---|---|---|---|---|---|---|
| ProTrendLines | 2,362.07 | 2,426.21 | 2,561.66 | 2,594.40 | 2,634.03 | 2,717.09 | 2,785.43 |
| Change (%) | -8.96% | -6.48% | -1.26% | - | +1.53% | +4.73% | +7.36% |
| Change | -232.33 | -168.19 | -32.74 | - | +39.63 | +122.69 | +191.03 |
| Level | Minor | Minor | Intermediate | - | Minor | Intermediate | Major |
Attention could also be paid to pivot points to set price objectives:
| Pivot points | S3 | S2 | S1 | PP | R1 | R2 | R3 |
|---|---|---|---|---|---|---|---|
| Standard | 2,495.13 | 2,539.18 | 2,563.71 | 2,607.76 | 2,632.29 | 2,676.34 | 2,700.87 |
| Camarilla | 2,569.37 | 2,575.66 | 2,581.94 | 2,588.23 | 2,594.52 | 2,600.80 | 2,607.09 |
| Woodie | 2,485.36 | 2,534.30 | 2,553.94 | 2,602.88 | 2,622.52 | 2,671.46 | 2,691.10 |
| Fibonacci | 2,539.18 | 2,565.38 | 2,581.57 | 2,607.76 | 2,633.96 | 2,650.15 | 2,676.34 |
| Pivot points | S3 | S2 | S1 | PP | R1 | R2 | R3 |
|---|---|---|---|---|---|---|---|
| Standard | 2,511.22 | 2,569.39 | 2,609.97 | 2,668.14 | 2,708.72 | 2,766.89 | 2,807.47 |
| Camarilla | 2,623.40 | 2,632.46 | 2,641.51 | 2,650.56 | 2,659.61 | 2,668.66 | 2,677.72 |
| Woodie | 2,502.44 | 2,564.99 | 2,601.19 | 2,663.74 | 2,699.94 | 2,762.49 | 2,798.69 |
| Fibonacci | 2,569.39 | 2,607.11 | 2,630.41 | 2,668.14 | 2,705.86 | 2,729.16 | 2,766.89 |
| Pivot points | S3 | S2 | S1 | PP | R1 | R2 | R3 |
|---|---|---|---|---|---|---|---|
| Standard | 2,311.93 | 2,424.40 | 2,537.33 | 2,649.80 | 2,762.73 | 2,875.20 | 2,988.13 |
| Camarilla | 2,588.28 | 2,608.94 | 2,629.60 | 2,650.26 | 2,670.92 | 2,691.58 | 2,712.25 |
| Woodie | 2,312.16 | 2,424.52 | 2,537.56 | 2,649.92 | 2,762.96 | 2,875.32 | 2,988.36 |
| Fibonacci | 2,424.40 | 2,510.50 | 2,563.70 | 2,649.80 | 2,735.90 | 2,789.10 | 2,875.20 |
Numerical data
The following is the status of technical indicators and moving averages registered at the time this technical analysis was created:
| RSI (14): | 40.47 | |
| MACD (12,26,9): | -8.0700 | |
| Directional Movement: | -8.58 | |
| AROON (14): | -28.57 | |
| DEMA (21): | 2,637.27 | |
| Parabolic SAR (0,02-0,02-0,2): | 2,723.44 | |
| Elder Ray (13): | -34.50 | |
| Super Trend (3,10): | 2,581.02 | |
| Zig ZAG (10): | 2,595.50 | |
| VORTEX (21): | 0.9600 | |
| Stochastique (14,3,5): | 14.10 | |
| TEMA (21): | 2,629.77 | |
| Williams %R (14): | -91.50 | |
| Chande Momentum Oscillator (20): | -47.50 | |
| Repulse (5,40,3): | -2.8200 | |
| ROCnROLL: | 2 | |
| TRIX (15,9): | -0.0200 | |
| Courbe Coppock: | 0.37 |
| MA7: | 2,647.68 | |
| MA20: | 2,648.95 | |
| MA50: | 2,670.51 | |
| MA100: | 2,605.98 | |
| MAexp7: | 2,630.50 | |
| MAexp20: | 2,645.89 | |
| MAexp50: | 2,642.97 | |
| MAexp100: | 2,591.14 | |
| Price / MA7: | -2.01% | |
| Price / MA20: | -2.06% | |
| Price / MA50: | -2.85% | |
| Price / MA100: | -0.44% | |
| Price / MAexp7: | -1.37% | |
| Price / MAexp20: | -1.95% | |
| Price / MAexp50: | -1.84% | |
| Price / MAexp100: | +0.13% |
News
Don't forget to follow the news on GOLD - USD. At the time of publication of this analysis, the latest news was as follows:
-
 XAU/USD Price Forecast Today, Technical Analysis (December 19): Gold's Bearish Correction Deepens
-
Gold (XAU/USD) Daily Price Forecast and Technical Analysis, December 19, 2024, #trading #gold #xau
-
XAU/USD Price Forecast Today, Technical Analysis (December 19): Gold Rallies but Gives Back Gains
-
Man steals gold chains from shop window
-
XAU/USD Price Forecast Today, Technical Analysis (December 18): Gold Drops Sharply After FOMC
About author

Online


Add a comment
Comments
0 comments on the analysis GOLD - USD - Daily