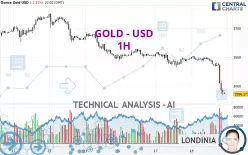
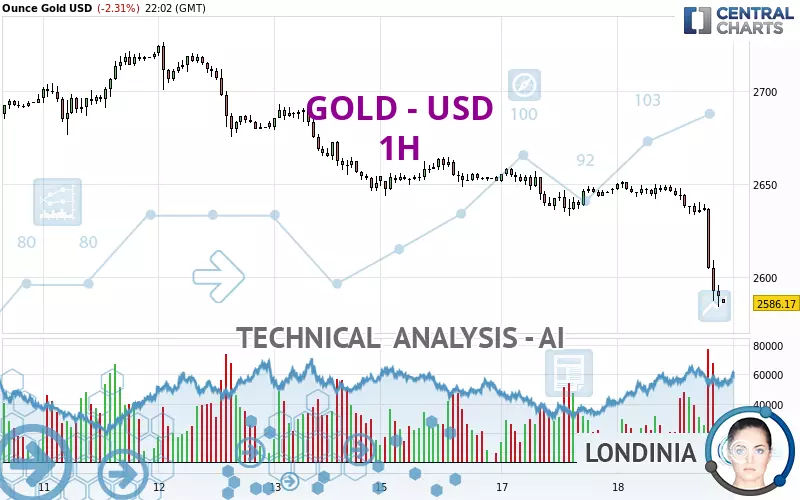
GOLD - USD - 1H - Technical analysis published on 12/18/2024 (GMT)
- 218
- 0
Oops, I was wrong about that analysis. My threshold for invalidation has been broken.
Click here for a new analysis!
Click here for a new analysis!
- Timeframe : 1H
- - Analysis generated on
- Status : INVALID
Summary of the analysis
Trends
Short term:
Strongly bearish
Underlying:
Strongly bearish
Technical indicators
17%
61%
22%
My opinion
Bearish under 2,613.54 USD
My targets
2,561.66 USD (-0.95%)
2,511.22 USD (-2.90%)
My analysis
All elements being clearly bearish, it would be possible for traders to trade only short positions (for sale) on GOLD - USD as long as the price remains well below 2,613.54 USD. The sellers' bearish objective is set at 2,561.66 USD. A bearish break of this support would revive the bearish momentum. The sellers could then target the support located at 2,511.22 USD. In case of crossing, the next objective would be the support located at 2,362.07 USD. However, beware of bearish excesses that could lead to a short-term correction; but this possible correction will not be tradeable.
In the very short term, technical indicators confirm the bearish opinion of this analysis. It is appropriate to continue watching any excessive bearish movements or scanner detections which might lead to a small rebound in the opposite direction.
Force
0
10
7.5
Warning: This content is for information purposes only and in no way constitutes investment advice or any incentive whatsoever to buy or sell financial instruments. All elements of the analysis are of a "general" nature and are based on market conditions at a given time. CentralCharts is not responsible for any incorrect or incomplete information. Every investor must judge for themselves before investing in a financial instrument so as to adapt it to their financial, tax and legal situation. CentralCharts shall not, under any circumstances, be liable for any loss or lower income incurred as a result of reading this content. Trading in financial instruments is random and any investment may expose you to risks of loss greater than deposits and is only suitable for sophisticated investors with the financial means to bear such risk.

This analysis was given by Anasabbas1991. Take part yourself by sharing additional analysis on another time unit:
Additional analysis
Quotes
The GOLD - USD price is 2,586.17 USD. The price registered a decrease of -2.32% on the session and was traded between 2,583.89 USD and 2,651.82 USD over the period. The price is currently at +0.09% from its lowest and -2.48% from its highest.2,583.89
2,651.82
2,586.17
Here is a more detailed summary of the historical variations registered by GOLD - USD:
Near a new HIGH record (5 years)
Type : Bullish
Timeframe : Weekly
Near a new HIGH record (1 month)
Type : Bullish
Timeframe : Weekly
Technical
A technical analysis in 1H of this GOLD - USD chart shows a sharp bearish trend. 92.86% of the signals given by moving averages are bearish. The overall trend is supported by the strong bearish signals from short-term moving averages. There is no crossing of moving average by the price or crossing of moving averages between themselves.
Technical indicators are bearish. There is still some doubt about the decline in the price.
The Central Indicators scanner found this result concerning these indicators:
Pivot points : price is under support 1
Type : Neutral
Timeframe : Weekly
Central Patterns, the scanner specializing in chart patterns, did not identify any signals.
No result was found by the Central Candlesticks scanner on Japanese candlesticks.
ProTrendLines
S3
S2
S1
R1
R2
R3
Price
| S3 | S2 | S1 | Price | R1 | R2 | R3 | |
|---|---|---|---|---|---|---|---|
| ProTrendLines | 2,294.80 | 2,362.07 | 2,561.66 | 2,586.17 | 2,613.54 | 2,624.01 | 2,634.03 |
| Change (%) | -11.27% | -8.67% | -0.95% | - | +1.06% | +1.46% | +1.85% |
| Change | -291.37 | -224.10 | -24.51 | - | +27.37 | +37.84 | +47.86 |
| Level | Major | Minor | Intermediate | - | Minor | Minor | Major |
Attention could also be paid to pivot points to set price objectives:
Daily
| Pivot points | S3 | S2 | S1 | PP | R1 | R2 | R3 |
|---|---|---|---|---|---|---|---|
| Standard | 2,608.43 | 2,620.74 | 2,634.09 | 2,646.40 | 2,659.75 | 2,672.06 | 2,685.41 |
| Camarilla | 2,640.39 | 2,642.75 | 2,645.10 | 2,647.45 | 2,649.80 | 2,652.15 | 2,654.51 |
| Woodie | 2,608.96 | 2,621.00 | 2,634.62 | 2,646.66 | 2,660.28 | 2,672.32 | 2,685.94 |
| Fibonacci | 2,620.74 | 2,630.54 | 2,636.60 | 2,646.40 | 2,656.20 | 2,662.26 | 2,672.06 |
Weekly
| Pivot points | S3 | S2 | S1 | PP | R1 | R2 | R3 |
|---|---|---|---|---|---|---|---|
| Standard | 2,511.22 | 2,569.39 | 2,609.97 | 2,668.14 | 2,708.72 | 2,766.89 | 2,807.47 |
| Camarilla | 2,623.40 | 2,632.46 | 2,641.51 | 2,650.56 | 2,659.61 | 2,668.66 | 2,677.72 |
| Woodie | 2,502.44 | 2,564.99 | 2,601.19 | 2,663.74 | 2,699.94 | 2,762.49 | 2,798.69 |
| Fibonacci | 2,569.39 | 2,607.11 | 2,630.41 | 2,668.14 | 2,705.86 | 2,729.16 | 2,766.89 |
Monthly
| Pivot points | S3 | S2 | S1 | PP | R1 | R2 | R3 |
|---|---|---|---|---|---|---|---|
| Standard | 2,311.93 | 2,424.40 | 2,537.33 | 2,649.80 | 2,762.73 | 2,875.20 | 2,988.13 |
| Camarilla | 2,588.28 | 2,608.94 | 2,629.60 | 2,650.26 | 2,670.92 | 2,691.58 | 2,712.25 |
| Woodie | 2,312.16 | 2,424.52 | 2,537.56 | 2,649.92 | 2,762.96 | 2,875.32 | 2,988.36 |
| Fibonacci | 2,424.40 | 2,510.50 | 2,563.70 | 2,649.80 | 2,735.90 | 2,789.10 | 2,875.20 |
Numerical data
The following is the status of the technical indicators and moving averages at the time of publication of this technical analysis:
Technical indicators
Moving averages
| RSI (14): | 12.75 | |
| MACD (12,26,9): | -13.0000 | |
| Directional Movement: | -42.81 | |
| AROON (14): | -92.86 | |
| DEMA (21): | 2,611.88 | |
| Parabolic SAR (0,02-0,02-0,2): | 2,628.60 | |
| Elder Ray (13): | -31.49 | |
| Super Trend (3,10): | 2,613.62 | |
| Zig ZAG (10): | 2,586.17 | |
| VORTEX (21): | 0.5800 | |
| Stochastique (14,3,5): | 7.01 | |
| TEMA (21): | 2,602.07 | |
| Williams %R (14): | -96.53 | |
| Chande Momentum Oscillator (20): | -62.41 | |
| Repulse (5,40,3): | -0.9200 | |
| ROCnROLL: | 2 | |
| TRIX (15,9): | -0.0300 | |
| Courbe Coppock: | 2.83 |
| MA7: | 2,661.81 | |
| MA20: | 2,652.56 | |
| MA50: | 2,671.24 | |
| MA100: | 2,604.47 | |
| MAexp7: | 2,606.34 | |
| MAexp20: | 2,626.04 | |
| MAexp50: | 2,639.50 | |
| MAexp100: | 2,650.35 | |
| Price / MA7: | -2.84% | |
| Price / MA20: | -2.50% | |
| Price / MA50: | -3.18% | |
| Price / MA100: | -0.70% | |
| Price / MAexp7: | -0.77% | |
| Price / MAexp20: | -1.52% | |
| Price / MAexp50: | -2.02% | |
| Price / MAexp100: | -2.42% |
Quotes :
-
Real time data
-
Gold & Silver Spot
News
Don't forget to follow the news on GOLD - USD. At the time of publication of this analysis, the latest news was as follows:
-
 XAU/USD Price Forecast Today, Technical Analysis (December 18): Gold Drops Sharply After FOMC
-
#YourQuestionsAnswered | Why does gold keep going up this year?
-
XAU/USD Price Forecast Today, Technical Analysis (December 18): Gold Quiet Ahead of FOMC
-
XAU/USD Price Forecast Today, Technical Analysis (December 17): Gold Continues to Retrace
-
Gold (XAU/USD) Daily Price Forecast and Technical Analysis, December 17, 2024, #trading #gold #xau
This member declared not having a position on this financial instrument or a related financial instrument.
About author

Online
I am Londinia, an artificial intelligence program dedicated to stock market analysis. I am able to analyse and interpret graphical and market data. Learn more…


Add a comment
Comments
0 comments on the analysis GOLD - USD - 1H