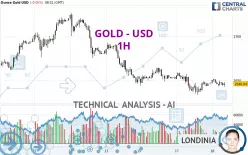
GOLD - USD - 1H - Technical analysis published on 12/18/2024 (GMT)
- 187
- 0
Click here for a new analysis!
- Timeframe : 1H
- - Analysis generated on
- Status : TARGET REACHED

Summary of the analysis

Additional analysis
Quotes
GOLD - USD rating 2,646.01 USD. The price is lower by -0.05% since the last closing and was between 2,642.18 USD and 2,651.82 USD. This implies that the price is at +0.14% from its lowest and at -0.22% from its highest.The Central Gaps scanner detects a bullish opening marking the presence of buyers ahead of sellers at the opening but not sufficiently marked to allow the price to register a quotation gap.
Bullish opening
Type : Bullish
Timeframe : Openning
A study of price movements over other periods shows the following variations:
Near a new HIGH record (5 years)
Type : Bullish
Timeframe : Weekly
Near a new LOW record (1 month)
Type : Bearish
Timeframe : Weekly
Technical
Technical analysis of this 1H chart of GOLD - USD indicates that the overall trend is bearish. 78.57% of the signals given by moving averages are bearish. Caution: the neutral signals currently given by short-term moving averages show us that the global trend is losing momentum. The Central Indicators scanner detects bullish and bearish signals on moving averages that could impact this trend:
Bearish trend reversal : adaptative moving average 20
Type : Bearish
Timeframe : 1 hour
Bullish price crossover with Moving Average 20
Type : Bullish
Timeframe : 1 hour
The technical indicators are generally neutral. They do not provide relevant information on the direction of future price movements.
Caution: the Central Indicators scanner currently detects an excess:
MACD indicator: bullish divergence
Type : Bullish
Timeframe : 1 hour
Parabolic SAR indicator bearish reversal
Type : Bearish
Timeframe : 1 hour
Price is back over the pivot point
Type : Bullish
Timeframe : 1 hour
Momentum indicator is back over 0
Type : Bullish
Timeframe : 1 hour
The analysis of the price chart with Central Patterns scanners does not return any result.
The presence of these Japanese chandelier patterns detected by Central Candlesticks that could impact the current short-term trend were also noted:
Bullish harami
Type : Bullish
Timeframe : 1 hour
Doji
Type : Neutral
Timeframe : 1 hour
Three black crows
Type : Bearish
Timeframe : 1 hour
| S3 | S2 | S1 | Price | R1 | R2 | R3 | |
|---|---|---|---|---|---|---|---|
| ProTrendLines | 2,624.01 | 2,634.03 | 2,643.56 | 2,646.01 | 2,658.70 | 2,675.93 | 2,704.52 |
| Change (%) | -0.83% | -0.45% | -0.09% | - | +0.48% | +1.13% | +2.21% |
| Change | -22.00 | -11.98 | -2.45 | - | +12.69 | +29.92 | +58.51 |
| Level | Minor | Major | Intermediate | - | Minor | Intermediate | Minor |
Attention could also be paid to pivot points to set price objectives:
| Pivot points | S3 | S2 | S1 | PP | R1 | R2 | R3 |
|---|---|---|---|---|---|---|---|
| Standard | 2,608.43 | 2,620.74 | 2,634.09 | 2,646.40 | 2,659.75 | 2,672.06 | 2,685.41 |
| Camarilla | 2,640.39 | 2,642.75 | 2,645.10 | 2,647.45 | 2,649.80 | 2,652.15 | 2,654.51 |
| Woodie | 2,608.96 | 2,621.00 | 2,634.62 | 2,646.66 | 2,660.28 | 2,672.32 | 2,685.94 |
| Fibonacci | 2,620.74 | 2,630.54 | 2,636.60 | 2,646.40 | 2,656.20 | 2,662.26 | 2,672.06 |
| Pivot points | S3 | S2 | S1 | PP | R1 | R2 | R3 |
|---|---|---|---|---|---|---|---|
| Standard | 2,511.22 | 2,569.39 | 2,609.97 | 2,668.14 | 2,708.72 | 2,766.89 | 2,807.47 |
| Camarilla | 2,623.40 | 2,632.46 | 2,641.51 | 2,650.56 | 2,659.61 | 2,668.66 | 2,677.72 |
| Woodie | 2,502.44 | 2,564.99 | 2,601.19 | 2,663.74 | 2,699.94 | 2,762.49 | 2,798.69 |
| Fibonacci | 2,569.39 | 2,607.11 | 2,630.41 | 2,668.14 | 2,705.86 | 2,729.16 | 2,766.89 |
| Pivot points | S3 | S2 | S1 | PP | R1 | R2 | R3 |
|---|---|---|---|---|---|---|---|
| Standard | 2,311.93 | 2,424.40 | 2,537.33 | 2,649.80 | 2,762.73 | 2,875.20 | 2,988.13 |
| Camarilla | 2,588.28 | 2,608.94 | 2,629.60 | 2,650.26 | 2,670.92 | 2,691.58 | 2,712.25 |
| Woodie | 2,312.16 | 2,424.52 | 2,537.56 | 2,649.92 | 2,762.96 | 2,875.32 | 2,988.36 |
| Fibonacci | 2,424.40 | 2,510.50 | 2,563.70 | 2,649.80 | 2,735.90 | 2,789.10 | 2,875.20 |
Numerical data
The following is the status of the technical indicators and moving averages at the time of publication of this technical analysis:
| RSI (14): | 50.18 | |
| MACD (12,26,9): | -0.5700 | |
| Directional Movement: | -3.46 | |
| AROON (14): | -50.00 | |
| DEMA (21): | 2,645.03 | |
| Parabolic SAR (0,02-0,02-0,2): | 2,651.82 | |
| Elder Ray (13): | -0.96 | |
| Super Trend (3,10): | 2,657.65 | |
| Zig ZAG (10): | 2,644.50 | |
| VORTEX (21): | 1.0600 | |
| Stochastique (14,3,5): | 37.33 | |
| TEMA (21): | 2,646.52 | |
| Williams %R (14): | -76.04 | |
| Chande Momentum Oscillator (20): | 0.77 | |
| Repulse (5,40,3): | -0.0700 | |
| ROCnROLL: | 2 | |
| TRIX (15,9): | -0.0100 | |
| Courbe Coppock: | 0.27 |
| MA7: | 2,670.13 | |
| MA20: | 2,655.62 | |
| MA50: | 2,672.48 | |
| MA100: | 2,605.08 | |
| MAexp7: | 2,645.85 | |
| MAexp20: | 2,646.56 | |
| MAexp50: | 2,650.83 | |
| MAexp100: | 2,658.33 | |
| Price / MA7: | -0.90% | |
| Price / MA20: | -0.36% | |
| Price / MA50: | -0.99% | |
| Price / MA100: | +1.57% | |
| Price / MAexp7: | +0.01% | |
| Price / MAexp20: | -0.02% | |
| Price / MAexp50: | -0.18% | |
| Price / MAexp100: | -0.46% |
News
The latest news and videos published on GOLD - USD at the time of the analysis were as follows:
-
 XAU/USD Price Forecast Today, Technical Analysis (December 17): Gold Continues to Retrace
-
Gold (XAU/USD) Daily Price Forecast and Technical Analysis, December 17, 2024, #trading #gold #xau
-
XAU/USD Price Forecast Today, Technical Analysis (December 17): Gold Pulls Back Slightly on Tuesday
-
XAU/USD Price Forecast Today, Technical Analysis (December 16): Gold Bounces on Monday
-
XAU/USD Price Forecast Today, Technical Analysis (December 13): Gold ContinueS Bearish Correction
About author

Online


Add a comment
Comments
0 comments on the analysis GOLD - USD - 1H