GOLD - USD - 1H - Technical analysis published on 12/13/2024 (GMT)
- 286
- 0
Click here for a new analysis!
- Timeframe : 1H
- - Analysis generated on
- Status : TARGET REACHED

Summary of the analysis

Additional analysis
Quotes
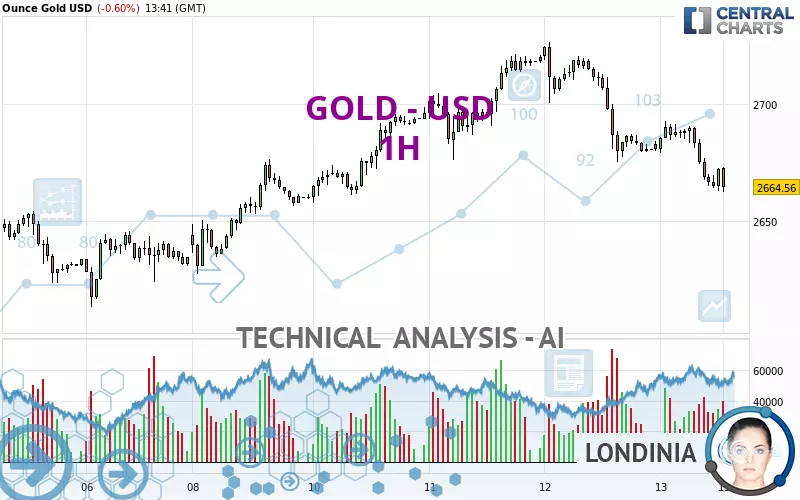
The GOLD - USD rating is 2,664.51 USD. The price registered a decrease of -0.60% on the session and was traded between 2,662.45 USD and 2,692.81 USD over the period. The price is currently at +0.08% from its lowest and -1.05% from its highest.The Central Gaps scanner detects a bearish opening marking the presence of sellers ahead of buyers at the opening but not sufficiently marked to allow the price to register a quotation gap.
Bearish opening
Type : Bearish
Timeframe : Openning
Here is a more detailed summary of the historical variations registered by GOLD - USD:
Near a new HIGH record (5 years)
Type : Bullish
Timeframe : Weekly
Near a new HIGH record (1 year)
Type : Bullish
Timeframe : Weekly
Near a new HIGH record (1st january)
Type : Bullish
Timeframe : Weekly
Near a new LOW record (1 month)
Type : Bearish
Timeframe : Weekly
Technical
A technical analysis in 1H of this GOLD - USD chart shows a bearish trend. 75.00% of the signals given by moving averages are bearish. The overall trend is reinforced by the strong bearish signals from short-term moving averages. The Central Indicators scanner does not detect any result on moving averages that would impact this trend.
An assessment of technical indicators shows a bearish signal.
Caution: the Central Indicators scanner currently detects an excess:
CCI indicator is oversold : under -100
Type : Neutral
Timeframe : 1 hour
Williams %R indicator is oversold : under -80
Type : Neutral
Timeframe : 1 hour
Pivot points : price is over resistance 1
Type : Neutral
Timeframe : Weekly
No signals are given by Central Patterns, a market scanner specialised in chart patterns, resistances and supports.
The Central Candlesticks scanner which studies Japanese candlesticks did not detect anything.
| S3 | S2 | S1 | Price | R1 | R2 | R3 | |
|---|---|---|---|---|---|---|---|
| ProTrendLines | 2,613.54 | 2,632.97 | 2,657.10 | 2,664.51 | 2,676.07 | 2,695.67 | 2,704.52 |
| Change (%) | -1.91% | -1.18% | -0.28% | - | +0.43% | +1.17% | +1.50% |
| Change | -50.97 | -31.54 | -7.41 | - | +11.56 | +31.16 | +40.01 |
| Level | Minor | Intermediate | Intermediate | - | Intermediate | Minor | Minor |
Pivot points can also be used to set your price objectives. Here is the price situation in relation to pivot points:
| Pivot points | S3 | S2 | S1 | PP | R1 | R2 | R3 |
|---|---|---|---|---|---|---|---|
| Standard | 2,610.74 | 2,642.97 | 2,661.84 | 2,694.07 | 2,712.94 | 2,745.17 | 2,764.04 |
| Camarilla | 2,666.66 | 2,671.34 | 2,676.03 | 2,680.71 | 2,685.39 | 2,690.08 | 2,694.76 |
| Woodie | 2,604.06 | 2,639.63 | 2,655.16 | 2,690.73 | 2,706.26 | 2,741.83 | 2,757.36 |
| Fibonacci | 2,642.97 | 2,662.49 | 2,674.55 | 2,694.07 | 2,713.59 | 2,725.65 | 2,745.17 |
| Pivot points | S3 | S2 | S1 | PP | R1 | R2 | R3 |
|---|---|---|---|---|---|---|---|
| Standard | 2,556.87 | 2,585.21 | 2,610.04 | 2,638.38 | 2,663.21 | 2,691.55 | 2,716.38 |
| Camarilla | 2,620.26 | 2,625.13 | 2,630.01 | 2,634.88 | 2,639.75 | 2,644.63 | 2,649.50 |
| Woodie | 2,555.13 | 2,584.33 | 2,608.30 | 2,637.50 | 2,661.47 | 2,690.67 | 2,714.64 |
| Fibonacci | 2,585.21 | 2,605.52 | 2,618.07 | 2,638.38 | 2,658.69 | 2,671.24 | 2,691.55 |
| Pivot points | S3 | S2 | S1 | PP | R1 | R2 | R3 |
|---|---|---|---|---|---|---|---|
| Standard | 2,311.93 | 2,424.40 | 2,537.33 | 2,649.80 | 2,762.73 | 2,875.20 | 2,988.13 |
| Camarilla | 2,588.28 | 2,608.94 | 2,629.60 | 2,650.26 | 2,670.92 | 2,691.58 | 2,712.25 |
| Woodie | 2,312.16 | 2,424.52 | 2,537.56 | 2,649.92 | 2,762.96 | 2,875.32 | 2,988.36 |
| Fibonacci | 2,424.40 | 2,510.50 | 2,563.70 | 2,649.80 | 2,735.90 | 2,789.10 | 2,875.20 |
Numerical data
The following are the details of the technical indicators and moving averages that were collected to generate this technical analysis:
| RSI (14): | 35.24 | |
| MACD (12,26,9): | -7.2100 | |
| Directional Movement: | -14.22 | |
| AROON (14): | -78.57 | |
| DEMA (21): | 2,670.85 | |
| Parabolic SAR (0,02-0,02-0,2): | 2,683.74 | |
| Elder Ray (13): | -6.99 | |
| Super Trend (3,10): | 2,686.73 | |
| Zig ZAG (10): | 2,668.09 | |
| VORTEX (21): | 0.9000 | |
| Stochastique (14,3,5): | 19.92 | |
| TEMA (21): | 2,667.61 | |
| Williams %R (14): | -79.81 | |
| Chande Momentum Oscillator (20): | -20.61 | |
| Repulse (5,40,3): | -0.0600 | |
| ROCnROLL: | 2 | |
| TRIX (15,9): | -0.0400 | |
| Courbe Coppock: | 0.83 |
| MA7: | 2,670.24 | |
| MA20: | 2,654.37 | |
| MA50: | 2,671.44 | |
| MA100: | 2,598.17 | |
| MAexp7: | 2,671.42 | |
| MAexp20: | 2,680.42 | |
| MAexp50: | 2,687.79 | |
| MAexp100: | 2,683.58 | |
| Price / MA7: | -0.21% | |
| Price / MA20: | +0.38% | |
| Price / MA50: | -0.26% | |
| Price / MA100: | +2.55% | |
| Price / MAexp7: | -0.26% | |
| Price / MAexp20: | -0.59% | |
| Price / MAexp50: | -0.87% | |
| Price / MAexp100: | -0.71% |
News
The last news published on GOLD - USD at the time of the generation of this analysis was as follows:
-
 XAU/USD Price Forecast Today, Technical Analysis (December 12): Gold Rises but Then Reverses
-
Gold (XAU/USD) Daily Price Forecast and Technical Analysis, December 12, 2024, #gold #xauusd #xau
-
XAU/USD Price Forecast Today, Technical Analysis (December 12): Gold Pulls Back Slightly
-
Olympic gold medalist refuses to wrestle biological men outside of 'practice'
-
XAU/USD Price Forecast Today, Technical Analysis (December 11): Gold Continues to Strengthen
About author

Online


Add a comment
Comments
0 comments on the analysis GOLD - USD - 1H