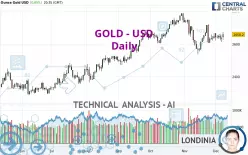
GOLD - USD - Daily - Technical analysis published on 12/09/2024 (GMT)
- 176
- 0
Click here for a new analysis!
- Timeframe : Daily
- - Analysis generated on
- Status : TARGET REACHED

Summary of the analysis

Additional analysis
Quotes
The GOLD - USD price is 2,658.16 USD. On the day, this instrument gained +0.88% with the lowest point at 2,627.55 USD and the highest point at 2,676.48 USD. The deviation from the price is +1.16% for the low point and -0.68% for the high point.So that you have an overall view of the price change, here is a table showing the variations over several periods:
Near a new HIGH record (5 years)
Type : Bullish
Timeframe : Weekly
Near a new HIGH record (1 year)
Type : Bullish
Timeframe : Weekly
Near a new HIGH record (1st january)
Type : Bullish
Timeframe : Weekly
Near a new LOW record (1 month)
Type : Bearish
Timeframe : Weekly
Technical
Technical analysis of this Daily chart of GOLD - USD indicates that the overall trend is strongly bullish. The signals given by moving averages are 82.14% bullish. This strongly bullish trend seems to be running out of steam given the signals being given by short-term moving averages. There is no crossing of moving average by the price or crossing of moving averages between themselves.
In fact, according to the parameters integrated into the Central Analyzer system, only 9 technical indicators out of 18 analysed are currently bullish. Caution: the Central Indicators scanner currently detects an excess:
MACD indicator: bullish divergence
Type : Bullish
Timeframe : Daily
Pivot points : price is over resistance 1
Type : Neutral
Timeframe : Daily
Central Patterns, the scanner specializing in chart patterns, did not identify any signals.
The Central Candlesticks scanner which studies Japanese candlesticks did not detect anything.
| S3 | S2 | S1 | Price | R1 | R2 | |
|---|---|---|---|---|---|---|
| ProTrendLines | 2,362.07 | 2,426.21 | 2,561.40 | 2,658.16 | 2,716.43 | 2,785.43 |
| Change (%) | -11.14% | -8.73% | -3.64% | - | +2.19% | +4.79% |
| Change | -296.09 | -231.95 | -96.76 | - | +58.27 | +127.27 |
| Level | Minor | Minor | Minor | - | Intermediate | Major |
Attention could also be paid to pivot points to set price objectives:
| Pivot points | S3 | S2 | S1 | PP | R1 | R2 | R3 |
|---|---|---|---|---|---|---|---|
| Standard | 2,584.89 | 2,599.21 | 2,617.05 | 2,631.37 | 2,649.21 | 2,663.53 | 2,681.37 |
| Camarilla | 2,626.04 | 2,628.98 | 2,631.93 | 2,634.88 | 2,637.83 | 2,640.78 | 2,643.72 |
| Woodie | 2,586.64 | 2,600.09 | 2,618.80 | 2,632.25 | 2,650.96 | 2,664.41 | 2,683.12 |
| Fibonacci | 2,599.21 | 2,611.50 | 2,619.09 | 2,631.37 | 2,643.66 | 2,651.25 | 2,663.53 |
| Pivot points | S3 | S2 | S1 | PP | R1 | R2 | R3 |
|---|---|---|---|---|---|---|---|
| Standard | 2,556.87 | 2,585.21 | 2,610.04 | 2,638.38 | 2,663.21 | 2,691.55 | 2,716.38 |
| Camarilla | 2,620.26 | 2,625.13 | 2,630.01 | 2,634.88 | 2,639.75 | 2,644.63 | 2,649.50 |
| Woodie | 2,555.13 | 2,584.33 | 2,608.30 | 2,637.50 | 2,661.47 | 2,690.67 | 2,714.64 |
| Fibonacci | 2,585.21 | 2,605.52 | 2,618.07 | 2,638.38 | 2,658.69 | 2,671.24 | 2,691.55 |
| Pivot points | S3 | S2 | S1 | PP | R1 | R2 | R3 |
|---|---|---|---|---|---|---|---|
| Standard | 2,311.93 | 2,424.40 | 2,537.33 | 2,649.80 | 2,762.73 | 2,875.20 | 2,988.13 |
| Camarilla | 2,588.28 | 2,608.94 | 2,629.60 | 2,650.26 | 2,670.92 | 2,691.58 | 2,712.25 |
| Woodie | 2,312.16 | 2,424.52 | 2,537.56 | 2,649.92 | 2,762.96 | 2,875.32 | 2,988.36 |
| Fibonacci | 2,424.40 | 2,510.50 | 2,563.70 | 2,649.80 | 2,735.90 | 2,789.10 | 2,875.20 |
Numerical data
The following is the status of technical indicators and moving averages registered at the time this technical analysis was created:
| RSI (14): | 52.19 | |
| MACD (12,26,9): | -4.8900 | |
| Directional Movement: | -0.16 | |
| AROON (14): | 0 | |
| DEMA (21): | 2,640.20 | |
| Parabolic SAR (0,02-0,02-0,2): | 2,715.15 | |
| Elder Ray (13): | 7.11 | |
| Super Trend (3,10): | 2,574.83 | |
| Zig ZAG (10): | 2,660.89 | |
| VORTEX (21): | 0.9400 | |
| Stochastique (14,3,5): | 39.51 | |
| TEMA (21): | 2,634.15 | |
| Williams %R (14): | -52.09 | |
| Chande Momentum Oscillator (20): | -8.25 | |
| Repulse (5,40,3): | 0.8000 | |
| ROCnROLL: | 1 | |
| TRIX (15,9): | -0.0500 | |
| Courbe Coppock: | 1.70 |
| MA7: | 2,644.91 | |
| MA20: | 2,630.89 | |
| MA50: | 2,668.68 | |
| MA100: | 2,586.09 | |
| MAexp7: | 2,645.13 | |
| MAexp20: | 2,647.75 | |
| MAexp50: | 2,640.37 | |
| MAexp100: | 2,580.97 | |
| Price / MA7: | +0.50% | |
| Price / MA20: | +1.04% | |
| Price / MA50: | -0.39% | |
| Price / MA100: | +2.79% | |
| Price / MAexp7: | +0.49% | |
| Price / MAexp20: | +0.39% | |
| Price / MAexp50: | +0.67% | |
| Price / MAexp100: | +2.99% |
News
Don't forget to follow the news on GOLD - USD. At the time of publication of this analysis, the latest news was as follows:
-
 XAU/USD Price Forecast Today, Technical Analysis (December 09): Gold Recovers Early on Monday
-
Gold (XAU/USD) Daily Price Forecast and Technical Analysis, December 9, 2024, #trading #gold
-
Climate change: How Alpine ski resorts are adapting to the end of the ‘white gold’ era
-
What is the role of gold in Russia’s wartime trade relations?
-
XAU/USD Price Forecast Today, Technical Analysis (December 06): Gold Fails Attempt to Break Down
About author

Online


Add a comment
Comments
0 comments on the analysis GOLD - USD - Daily