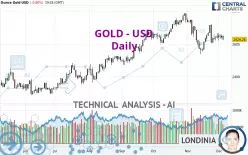
GOLD - USD - Daily - Technical analysis published on 12/05/2024 (GMT)
- 156
- 0
Click here for a new analysis!
- Timeframe : Daily
- - Analysis generated on
- Status : LEVEL MAINTAINED

Summary of the analysis

Additional analysis
Quotes
The GOLD - USD price is 2,629.27 USD. The price is lower by -0.80% since the last closing and was between 2,623.57 USD and 2,655.62 USD. This implies that the price is at +0.22% from its lowest and at -0.99% from its highest.A bullish opening was detected by the Central Gaps scanner. Buyers are trying to impose a bullish momentum in the very short term.
Bullish opening
Type : Bullish
Timeframe : Openning
So that you have an overall view of the price change, here is a table showing the variations over several periods:
Near a new HIGH record (5 years)
Type : Bullish
Timeframe : Weekly
Near a new HIGH record (1 month)
Type : Bullish
Timeframe : Weekly
Technical
Technical analysis of this Daily chart of GOLD - USD indicates that the overall trend is not clearly defined. The trend could quickly turn bearish due to the strong bearish signals currently being given by short-term moving averages. The Central Indicators scanner does not detect any result on moving averages that would impact this trend.
On the 18 technical indicators analysed, 4 are bullish, 9 are neutral and 5 are bearish. Central Indicators, the scanner specialised in technical indicators, has identified these signals:
Pivot points : price is under support 1
Type : Neutral
Timeframe : Daily
Parabolic SAR indicator bearish reversal
Type : Bearish
Timeframe : Daily
Ichimoku : price is under the cloud
Type : Bearish
Timeframe : Daily
Momentum indicator is back under 0
Type : Bearish
Timeframe : Daily
Williams %R indicator is back under -50
Type : Bearish
Timeframe : Daily
No signals are given by Central Patterns, a market scanner specialised in chart patterns, resistances and supports.
For a small setback in the very short term, the Central Candlesticks scanner currently notes the presence of this bearish pattern in Japanese candlesticks:
Bearish engulfing lines
Type : Bearish
Timeframe : Daily
| S3 | S2 | S1 | Price | R1 | R2 | |
|---|---|---|---|---|---|---|
| ProTrendLines | 2,362.07 | 2,426.21 | 2,561.40 | 2,629.27 | 2,716.92 | 2,785.43 |
| Change (%) | -10.16% | -7.72% | -2.58% | - | +3.33% | +5.94% |
| Change | -267.20 | -203.06 | -67.87 | - | +87.65 | +156.16 |
| Level | Minor | Minor | Minor | - | Intermediate | Major |
Pivot points can also be used to set your price objectives. Here is the price situation in relation to pivot points:
| Pivot points | S3 | S2 | S1 | PP | R1 | R2 | R3 |
|---|---|---|---|---|---|---|---|
| Standard | 2,611.52 | 2,622.00 | 2,636.22 | 2,646.70 | 2,660.92 | 2,671.40 | 2,685.62 |
| Camarilla | 2,643.64 | 2,645.90 | 2,648.17 | 2,650.43 | 2,652.69 | 2,654.96 | 2,657.22 |
| Woodie | 2,613.38 | 2,622.94 | 2,638.08 | 2,647.64 | 2,662.78 | 2,672.34 | 2,687.48 |
| Fibonacci | 2,622.00 | 2,631.44 | 2,637.27 | 2,646.70 | 2,656.14 | 2,661.97 | 2,671.40 |
| Pivot points | S3 | S2 | S1 | PP | R1 | R2 | R3 |
|---|---|---|---|---|---|---|---|
| Standard | 2,480.50 | 2,542.89 | 2,596.57 | 2,658.96 | 2,712.64 | 2,775.03 | 2,828.71 |
| Camarilla | 2,618.34 | 2,628.98 | 2,639.62 | 2,650.26 | 2,660.90 | 2,671.54 | 2,682.18 |
| Woodie | 2,476.16 | 2,540.71 | 2,592.23 | 2,656.78 | 2,708.30 | 2,772.85 | 2,824.37 |
| Fibonacci | 2,542.89 | 2,587.23 | 2,614.62 | 2,658.96 | 2,703.30 | 2,730.69 | 2,775.03 |
| Pivot points | S3 | S2 | S1 | PP | R1 | R2 | R3 |
|---|---|---|---|---|---|---|---|
| Standard | 2,311.93 | 2,424.40 | 2,537.33 | 2,649.80 | 2,762.73 | 2,875.20 | 2,988.13 |
| Camarilla | 2,588.28 | 2,608.94 | 2,629.60 | 2,650.26 | 2,670.92 | 2,691.58 | 2,712.25 |
| Woodie | 2,312.16 | 2,424.52 | 2,537.56 | 2,649.92 | 2,762.96 | 2,875.32 | 2,988.36 |
| Fibonacci | 2,424.40 | 2,510.50 | 2,563.70 | 2,649.80 | 2,735.90 | 2,789.10 | 2,875.20 |
Numerical data
The following are the details of the technical indicators and moving averages that were collected to generate this technical analysis:
| RSI (14): | 45.87 | |
| MACD (12,26,9): | -7.4100 | |
| Directional Movement: | -4.79 | |
| AROON (14): | 42.86 | |
| DEMA (21): | 2,636.97 | |
| Parabolic SAR (0,02-0,02-0,2): | 2,721.34 | |
| Elder Ray (13): | -2.58 | |
| Super Trend (3,10): | 2,574.83 | |
| Zig ZAG (10): | 2,625.71 | |
| VORTEX (21): | 0.9700 | |
| Stochastique (14,3,5): | 51.47 | |
| TEMA (21): | 2,626.75 | |
| Williams %R (14): | -60.40 | |
| Chande Momentum Oscillator (20): | -10.04 | |
| Repulse (5,40,3): | -1.2000 | |
| ROCnROLL: | 2 | |
| TRIX (15,9): | -0.0600 | |
| Courbe Coppock: | 2.21 |
| MA7: | 2,641.06 | |
| MA20: | 2,631.27 | |
| MA50: | 2,668.49 | |
| MA100: | 2,581.04 | |
| MAexp7: | 2,639.69 | |
| MAexp20: | 2,646.81 | |
| MAexp50: | 2,639.42 | |
| MAexp100: | 2,578.10 | |
| Price / MA7: | -0.45% | |
| Price / MA20: | -0.08% | |
| Price / MA50: | -1.47% | |
| Price / MA100: | +1.87% | |
| Price / MAexp7: | -0.39% | |
| Price / MAexp20: | -0.66% | |
| Price / MAexp50: | -0.38% | |
| Price / MAexp100: | +1.98% |
News
The last news published on GOLD - USD at the time of the generation of this analysis was as follows:
-
 Gold Daily Forecast and Technical Analysis, December 3, 2024, #trading #gold #xauusd
-
XAU/USD Price Forecast Today, Technical Analysis (December 05): Gold Does Very Little
-
Technical Analysis on GBPUSD, EURJPY, Gold
-
XAU/USD Price Forecast Today, Technical Analysis (December 04): Gold Continues to Do Nothing
-
Michael Kramer @Themarketchronicles | Major indices make gains while gold stabilises
About author

Online


Add a comment
Comments
0 comments on the analysis GOLD - USD - Daily