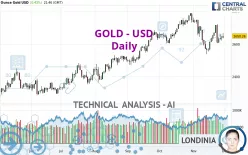
GOLD - USD - Daily - Technical analysis published on 12/01/2024 (GMT)
- 153
- 0
Click here for a new analysis!
- Timeframe : Daily
- - Analysis generated on
- Status : TARGET REACHED

Summary of the analysis

Additional analysis
Quotes
The GOLD - USD rating is 2,650.26 USD. The price registered an increase of +0.43% on the session with the lowest point at 2,634.07 USD and the highest point at 2,666.40 USD. The deviation from the price is +0.61% for the low point and -0.61% for the high point.The Central Gaps scanner detects a bullish opening. A small advantage for buyers in the very short term.
Bullish opening
Type : Bullish
Timeframe : Openning
So that you have an overall view of the price change, here is a table showing the variations over several periods:
Near a new HIGH record (5 years)
Type : Bullish
Timeframe : Weekly
Near a new HIGH record (1 year)
Type : Bullish
Timeframe : Weekly
Near a new HIGH record (1st january)
Type : Bullish
Timeframe : Weekly
Near a new HIGH record (1 month)
Type : Bullish
Timeframe : Weekly
Technical
Technical analysis of GOLD - USD in Daily shows an overall bullish trend. 78.57% of the signals given by moving averages are bullish. The overall trend seems to be showing some signs of weakness, as do the tentative bullish signals given by short-term moving averages. The Central Indicators scanner detects a bullish signal on moving averages that could impact this trend:
Bullish price crossover with Moving Average 20
Type : Bullish
Timeframe : Daily
In fact, 12 technical indicators on 18 studied are currently bullish. Central Indicators, the detector scanner for these technical indicators has recently detected several signals:
MACD crosses UP its Moving Average
Type : Bullish
Timeframe : Daily
Price is back under the pivot point
Type : Bearish
Timeframe : Weekly
The analysis of the price chart with Central Patterns scanners does not return any result.
No result was found by the Central Candlesticks scanner on Japanese candlesticks.
| S3 | S2 | S1 | Price | R1 | R2 | |
|---|---|---|---|---|---|---|
| ProTrendLines | 2,362.07 | 2,426.21 | 2,561.40 | 2,650.26 | 2,672.68 | 2,785.43 |
| Change (%) | -10.87% | -8.45% | -3.35% | - | +0.85% | +5.10% |
| Change | -288.19 | -224.05 | -88.86 | - | +22.42 | +135.17 |
| Level | Minor | Minor | Minor | - | Intermediate | Intermediate |
Pivot points can also be used to set your price objectives. Here is the price situation in relation to pivot points:
| Pivot points | S3 | S2 | S1 | PP | R1 | R2 | R3 |
|---|---|---|---|---|---|---|---|
| Standard | 2,601.76 | 2,617.91 | 2,634.09 | 2,650.24 | 2,666.42 | 2,682.57 | 2,698.75 |
| Camarilla | 2,641.37 | 2,644.33 | 2,647.30 | 2,650.26 | 2,653.22 | 2,656.19 | 2,659.15 |
| Woodie | 2,601.77 | 2,617.92 | 2,634.10 | 2,650.25 | 2,666.43 | 2,682.58 | 2,698.76 |
| Fibonacci | 2,617.91 | 2,630.26 | 2,637.89 | 2,650.24 | 2,662.59 | 2,670.22 | 2,682.57 |
| Pivot points | S3 | S2 | S1 | PP | R1 | R2 | R3 |
|---|---|---|---|---|---|---|---|
| Standard | 2,480.50 | 2,542.89 | 2,596.57 | 2,658.96 | 2,712.64 | 2,775.03 | 2,828.71 |
| Camarilla | 2,618.34 | 2,628.98 | 2,639.62 | 2,650.26 | 2,660.90 | 2,671.54 | 2,682.18 |
| Woodie | 2,476.16 | 2,540.71 | 2,592.23 | 2,656.78 | 2,708.30 | 2,772.85 | 2,824.37 |
| Fibonacci | 2,542.89 | 2,587.23 | 2,614.62 | 2,658.96 | 2,703.30 | 2,730.69 | 2,775.03 |
| Pivot points | S3 | S2 | S1 | PP | R1 | R2 | R3 |
|---|---|---|---|---|---|---|---|
| Standard | 2,449.76 | 2,526.52 | 2,636.63 | 2,713.39 | 2,823.50 | 2,900.26 | 3,010.37 |
| Camarilla | 2,695.36 | 2,712.49 | 2,729.62 | 2,746.75 | 2,763.88 | 2,781.01 | 2,798.14 |
| Woodie | 2,466.45 | 2,534.86 | 2,653.32 | 2,721.73 | 2,840.19 | 2,908.60 | 3,027.06 |
| Fibonacci | 2,526.52 | 2,597.90 | 2,642.00 | 2,713.39 | 2,784.77 | 2,828.87 | 2,900.26 |
Numerical data
The following is the status of the technical indicators and moving averages at the time of publication of this technical analysis:
| RSI (14): | 49.63 | |
| MACD (12,26,9): | -8.5600 | |
| Directional Movement: | -1.35 | |
| AROON (14): | 50.00 | |
| DEMA (21): | 2,639.74 | |
| Parabolic SAR (0,02-0,02-0,2): | 2,618.49 | |
| Elder Ray (13): | 5.48 | |
| Super Trend (3,10): | 2,574.83 | |
| Zig ZAG (10): | 2,650.26 | |
| VORTEX (21): | 0.8900 | |
| Stochastique (14,3,5): | 57.02 | |
| TEMA (21): | 2,624.61 | |
| Williams %R (14): | -38.53 | |
| Chande Momentum Oscillator (20): | 79.38 | |
| Repulse (5,40,3): | 0.0800 | |
| ROCnROLL: | 1 | |
| TRIX (15,9): | -0.0600 | |
| Courbe Coppock: | 1.29 |
| MA7: | 2,650.57 | |
| MA20: | 2,645.79 | |
| MA50: | 2,669.52 | |
| MA100: | 2,573.35 | |
| MAexp7: | 2,642.58 | |
| MAexp20: | 2,650.21 | |
| MAexp50: | 2,639.27 | |
| MAexp100: | 2,573.09 | |
| Price / MA7: | -0.01% | |
| Price / MA20: | +0.17% | |
| Price / MA50: | -0.72% | |
| Price / MA100: | +2.99% | |
| Price / MAexp7: | +0.29% | |
| Price / MAexp20: | +0.00% | |
| Price / MAexp50: | +0.42% | |
| Price / MAexp100: | +3.00% |
News
Don't forget to follow the news on GOLD - USD. At the time of publication of this analysis, the latest news was as follows:
-
 XAU/USD Price Forecast Today, Technical Analysis (November 29): Gold Rallies with Weak Momentum
-
XAU/USD Weekly Forecast, Technical Analysis (Dec 02-06): Gold Falls for the Week but Finds Support
-
XAU/USD Price Forecast Today, Technical Analysis (November 28): Gold Finds Resistance Around MA
-
Gold Forecast November 29, 2024
-
XAU/USD Price Forecast Today, Technical Analysis (November 28): Gold Bounces Slightly
About author

Online


Add a comment
Comments
0 comments on the analysis GOLD - USD - Daily