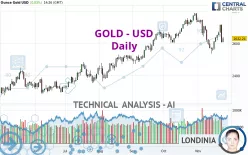
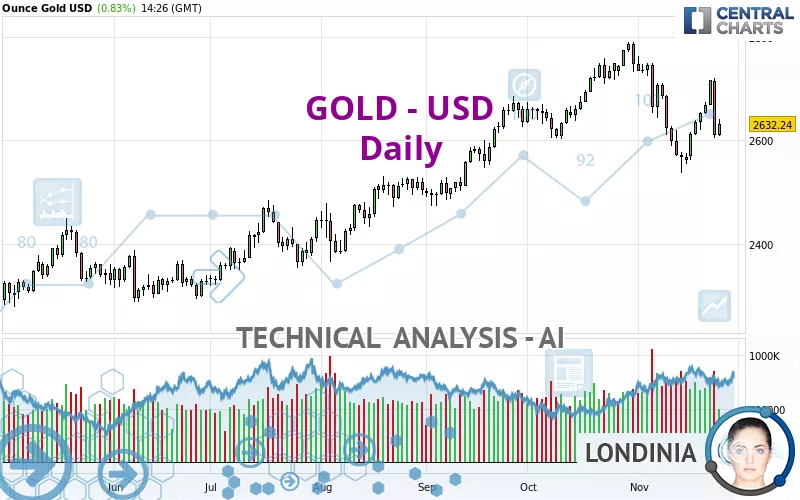
GOLD - USD - Daily - Technical analysis published on 11/26/2024 (GMT)
- 198
- 0
Click here for a new analysis!
- Timeframe : Daily
- - Analysis generated on
- Status : INVALID
Summary of the analysis

Additional analysis
Quotes
The GOLD - USD price is 2,632.15 USD. On the day, this instrument gained +0.83% and was traded between 2,608.73 USD and 2,642.00 USD over the period. The price is currently at +0.90% from its lowest and -0.37% from its highest.The Central Gaps scanner detects a bearish opening. A small advantage for sellers in the very short term.
Bearish opening
Type : Bearish
Timeframe : Openning
So that you have an overall view of the price change, here is a table showing the variations over several periods:
Near a new HIGH record (5 years)
Type : Bullish
Timeframe : Weekly
Near a new LOW record (1 month)
Type : Bearish
Timeframe : Weekly
Technical
A technical analysis in Daily of this GOLD - USD chart shows a slightly bullish trend. 53.57% of the signals given by moving averages are bullish. Caution: a reversal of the trend could be possible given the strong bearish signals of short-term moving averages. The Central Indicators market scanner is currently detecting several bearish and bullish signals that could impact this trend:
Bearish trend reversal : adaptative moving average 20
Type : Bearish
Timeframe : Daily
Bearish trend reversal : adaptative moving average 50
Type : Bearish
Timeframe : Daily
Moving Average bearish crossovers : MA20 & MA50
Type : Bearish
Timeframe : Daily
Bullish price crossover with adaptative moving average 100
Type : Bullish
Timeframe : Daily
In fact, Central Analyzer took into account 18 technical indicators and the result was as follows: 6 are bullish, 6 are neutral and 6 are bearish. The Central Indicators scanner found this result concerning these indicators:
Price is back under the pivot point
Type : Bearish
Timeframe : Weekly
Central Patterns, the scanner specializing in chart patterns, did not identify any signals.
The Central Candlesticks scanner, specialised in Japanese candlesticks, did not identify any signals.
| S3 | S2 | S1 | Price | R1 | R2 | R3 | |
|---|---|---|---|---|---|---|---|
| ProTrendLines | 2,362.07 | 2,525.34 | 2,608.46 | 2,632.15 | 2,672.68 | 2,721.33 | 2,785.43 |
| Change (%) | -10.26% | -4.06% | -0.90% | - | +1.54% | +3.39% | +5.82% |
| Change | -270.08 | -106.81 | -23.69 | - | +40.53 | +89.18 | +153.28 |
| Level | Intermediate | Intermediate | Major | - | Intermediate | Intermediate | Major |
Pivot points can also be used to set your price objectives. Here is the price situation in relation to pivot points:
| Pivot points | S3 | S2 | S1 | PP | R1 | R2 | R3 |
|---|---|---|---|---|---|---|---|
| Standard | 2,454.05 | 2,529.66 | 2,570.12 | 2,645.73 | 2,686.19 | 2,761.80 | 2,802.26 |
| Camarilla | 2,578.66 | 2,589.30 | 2,599.94 | 2,610.58 | 2,621.22 | 2,631.86 | 2,642.50 |
| Woodie | 2,436.48 | 2,520.87 | 2,552.55 | 2,636.94 | 2,668.62 | 2,753.01 | 2,784.69 |
| Fibonacci | 2,529.66 | 2,574.00 | 2,601.39 | 2,645.73 | 2,690.07 | 2,717.46 | 2,761.80 |
| Pivot points | S3 | S2 | S1 | PP | R1 | R2 | R3 |
|---|---|---|---|---|---|---|---|
| Standard | 2,459.22 | 2,510.78 | 2,613.30 | 2,664.86 | 2,767.38 | 2,818.94 | 2,921.46 |
| Camarilla | 2,673.45 | 2,687.57 | 2,701.70 | 2,715.82 | 2,729.94 | 2,744.07 | 2,758.19 |
| Woodie | 2,484.70 | 2,523.52 | 2,638.78 | 2,677.60 | 2,792.86 | 2,831.68 | 2,946.94 |
| Fibonacci | 2,510.78 | 2,569.64 | 2,606.00 | 2,664.86 | 2,723.72 | 2,760.08 | 2,818.94 |
| Pivot points | S3 | S2 | S1 | PP | R1 | R2 | R3 |
|---|---|---|---|---|---|---|---|
| Standard | 2,449.76 | 2,526.52 | 2,636.63 | 2,713.39 | 2,823.50 | 2,900.26 | 3,010.37 |
| Camarilla | 2,695.36 | 2,712.49 | 2,729.62 | 2,746.75 | 2,763.88 | 2,781.01 | 2,798.14 |
| Woodie | 2,466.45 | 2,534.86 | 2,653.32 | 2,721.73 | 2,840.19 | 2,908.60 | 3,027.06 |
| Fibonacci | 2,526.52 | 2,597.90 | 2,642.00 | 2,713.39 | 2,784.77 | 2,828.87 | 2,900.26 |
Numerical data
The following is the status of technical indicators and moving averages registered at the time this technical analysis was created:
| RSI (14): | 46.55 | |
| MACD (12,26,9): | -10.7600 | |
| Directional Movement: | -6.75 | |
| AROON (14): | -42.86 | |
| DEMA (21): | 2,640.79 | |
| Parabolic SAR (0,02-0,02-0,2): | 2,580.26 | |
| Elder Ray (13): | -19.83 | |
| Super Trend (3,10): | 2,574.83 | |
| Zig ZAG (10): | 2,627.26 | |
| VORTEX (21): | 0.8800 | |
| Stochastique (14,3,5): | 56.00 | |
| TEMA (21): | 2,619.67 | |
| Williams %R (14): | -49.95 | |
| Chande Momentum Oscillator (20): | -57.64 | |
| Repulse (5,40,3): | -1.2300 | |
| ROCnROLL: | -1 | |
| TRIX (15,9): | -0.0600 | |
| Courbe Coppock: | 5.64 |
| MA7: | 2,646.30 | |
| MA20: | 2,662.67 | |
| MA50: | 2,666.31 | |
| MA100: | 2,566.06 | |
| MAexp7: | 2,640.55 | |
| MAexp20: | 2,652.53 | |
| MAexp50: | 2,638.75 | |
| MAexp100: | 2,568.95 | |
| Price / MA7: | -0.53% | |
| Price / MA20: | -1.15% | |
| Price / MA50: | -1.28% | |
| Price / MA100: | +2.58% | |
| Price / MAexp7: | -0.32% | |
| Price / MAexp20: | -0.77% | |
| Price / MAexp50: | -0.25% | |
| Price / MAexp100: | +2.46% |
News
The latest news and videos published on GOLD - USD at the time of the analysis were as follows:
-
 Gold Daily Forecast and Technical Analysis, November 252024, by Chris Lewis for FX Empire #xauusd
-
XAU/USD Price Forecast Today, Technical Analysis (November 25): Gold Pulls Back a Little Bit
-
Gold Forecast November 25, 2024
-
XAU/USD Price Forecast Today, Technical Analysis (November 22): Gold Continues to Plow Higher
-
XAU/USD Price Forecast Today, Technical Analysis (November 21): Gold Busts Through the 50-Day MA
About author

Online


Add a comment
Comments
0 comments on the analysis GOLD - USD - Daily