| Open: | - |
| Change: | - |
| Volume: | - |
| Low: | - |
| High: | - |
| High / Low range: | - |
| Type: | Commodities |
| Ticker: | XAUUSD |
| ISIN: |
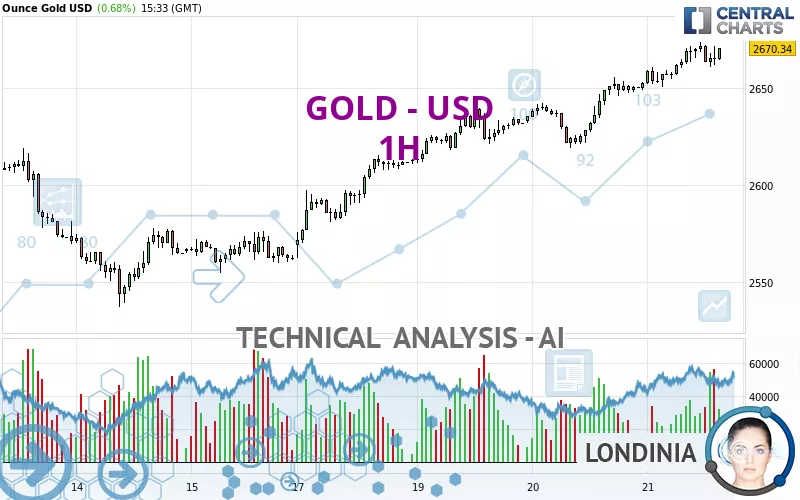
GOLD - USD - 1H - Technical analysis published on 11/21/2024 (GMT)
- 150
- 0
- 11/21/2024 - 15:33
Click here for a new analysis!
- Timeframe : 1H
- - Analysis generated on 11/21/2024 - 15:33
- Status : LEVEL MAINTAINED

Summary of the analysis

Additional analysis
Quotes
The GOLD - USD rating is 2,670.31 USD. The price registered an increase of +0.68% on the session and was traded between 2,650.46 USD and 2,673.56 USD over the period. The price is currently at +0.75% from its lowest and -0.12% from its highest.The Central Gaps scanner detects a bearish opening marking the presence of sellers ahead of buyers at the opening but not sufficiently marked to allow the price to register a quotation gap.
Bearish opening
Type : Bearish
Timeframe : Openning
Here is a more detailed summary of the historical variations registered by GOLD - USD:
Near a new HIGH record (5 years)
Type : Bullish
Timeframe : Weekly
Near a new HIGH record (1 year)
Type : Bullish
Timeframe : Weekly
Near a new HIGH record (1st january)
Type : Bullish
Timeframe : Weekly
Near a new HIGH record (1 month)
Type : Bullish
Timeframe : Weekly
Technical
Technical analysis of GOLD - USD in 1H shows a strongly overall bullish trend. 92.86% of the signals given by moving averages are bullish. This strongly bullish trend is supported by the strong bullish signals given by short-term moving averages. There is no crossing of moving average by the price or crossing of moving averages between themselves.
The probability of a further increase are moderate given the direction of the technical indicators.
Other results related to technical indicators were also found by the Central Indicators scanner:
Pivot points : price is over resistance 1
Type : Neutral
Timeframe : 1 hour
Pivot points : price is over resistance 1
Type : Neutral
Timeframe : Weekly
The analysis of the price chart with Central Patterns scanners does not return any result.
The presence of a bullish Japanese candlestick pattern detected by Central Candlesticks that could cause a very short term rebound was also detected:
Bullish harami
Type : Bullish
Timeframe : 1 hour
| S3 | S2 | S1 | Price | R1 | R2 | R3 | |
|---|---|---|---|---|---|---|---|
| ProTrendLines | 2,608.46 | 2,619.17 | 2,655.48 | 2,670.31 | 2,672.68 | 2,721.33 | 2,785.43 |
| Change (%) | -2.32% | -1.92% | -0.56% | - | +0.09% | +1.91% | +4.31% |
| Change | -61.85 | -51.14 | -14.83 | - | +2.37 | +51.02 | +115.12 |
| Level | Intermediate | Major | Minor | - | Intermediate | Minor | Major |
To determine price objectives, it is also possible to use the pivot points. Here is the price position in relation to pivot points:
| Pivot points | S3 | S2 | S1 | PP | R1 | R2 | R3 |
|---|---|---|---|---|---|---|---|
| Standard | 2,592.40 | 2,605.66 | 2,628.96 | 2,642.22 | 2,665.52 | 2,678.78 | 2,702.08 |
| Camarilla | 2,642.21 | 2,645.56 | 2,648.91 | 2,652.26 | 2,655.61 | 2,658.96 | 2,662.31 |
| Woodie | 2,597.42 | 2,608.17 | 2,633.98 | 2,644.73 | 2,670.54 | 2,681.29 | 2,707.10 |
| Fibonacci | 2,605.66 | 2,619.63 | 2,628.25 | 2,642.22 | 2,656.19 | 2,664.81 | 2,678.78 |
| Pivot points | S3 | S2 | S1 | PP | R1 | R2 | R3 |
|---|---|---|---|---|---|---|---|
| Standard | 2,352.56 | 2,444.71 | 2,503.19 | 2,595.34 | 2,653.82 | 2,745.97 | 2,804.45 |
| Camarilla | 2,520.24 | 2,534.05 | 2,547.85 | 2,561.66 | 2,575.47 | 2,589.28 | 2,603.08 |
| Woodie | 2,335.72 | 2,436.29 | 2,486.35 | 2,586.92 | 2,636.98 | 2,737.55 | 2,787.61 |
| Fibonacci | 2,444.71 | 2,502.25 | 2,537.80 | 2,595.34 | 2,652.88 | 2,688.43 | 2,745.97 |
| Pivot points | S3 | S2 | S1 | PP | R1 | R2 | R3 |
|---|---|---|---|---|---|---|---|
| Standard | 2,449.76 | 2,526.52 | 2,636.63 | 2,713.39 | 2,823.50 | 2,900.26 | 3,010.37 |
| Camarilla | 2,695.36 | 2,712.49 | 2,729.62 | 2,746.75 | 2,763.88 | 2,781.01 | 2,798.14 |
| Woodie | 2,466.45 | 2,534.86 | 2,653.32 | 2,721.73 | 2,840.19 | 2,908.60 | 3,027.06 |
| Fibonacci | 2,526.52 | 2,597.90 | 2,642.00 | 2,713.39 | 2,784.77 | 2,828.87 | 2,900.26 |
Numerical data
The following is the status of the technical indicators and moving averages at the time of publication of this technical analysis:
| RSI (14): | 64.88 | |
| MACD (12,26,9): | 7.2100 | |
| Directional Movement: | 16.25 | |
| AROON (14): | 57.14 | |
| DEMA (21): | 2,669.02 | |
| Parabolic SAR (0,02-0,02-0,2): | 2,673.04 | |
| Elder Ray (13): | 5.22 | |
| Super Trend (3,10): | 2,653.95 | |
| Zig ZAG (10): | 2,666.15 | |
| VORTEX (21): | 1.1300 | |
| Stochastique (14,3,5): | 65.52 | |
| TEMA (21): | 2,670.32 | |
| Williams %R (14): | -28.75 | |
| Chande Momentum Oscillator (20): | 12.91 | |
| Repulse (5,40,3): | -0.0400 | |
| ROCnROLL: | 1 | |
| TRIX (15,9): | 0.0400 | |
| Courbe Coppock: | 1.06 |
| MA7: | 2,609.58 | |
| MA20: | 2,678.25 | |
| MA50: | 2,661.90 | |
| MA100: | 2,557.68 | |
| MAexp7: | 2,666.06 | |
| MAexp20: | 2,659.48 | |
| MAexp50: | 2,645.39 | |
| MAexp100: | 2,631.07 | |
| Price / MA7: | +2.33% | |
| Price / MA20: | -0.30% | |
| Price / MA50: | +0.32% | |
| Price / MA100: | +4.40% | |
| Price / MAexp7: | +0.16% | |
| Price / MAexp20: | +0.41% | |
| Price / MAexp50: | +0.94% | |
| Price / MAexp100: | +1.49% |
News
The latest news and videos published on GOLD - USD at the time of the analysis were as follows:
-
11/21/2024 - 14:26
 XAU/USD Price Forecast Today, Technical Analysis (November 21): Gold Continues to Plow Higher
-
11/20/2024 - 21:35
XAU/USD Price Forecast Today, Technical Analysis (November 20): Gold Continues Its Counter-trend
-
11/20/2024 - 16:15
Families urge authorities to rescue illegal gold miners in South Africa | DW News
-
11/20/2024 - 16:05
XAU/USD Price Forecast Today, Technical Analysis (November 20): Gold Continues to Find Buyers
-
11/19/2024 - 15:47
Gold Daily Forecast and Technical Analysis, November 19 2024, by Chris Lewis for FX Empire #trading
About author

Online


Add a comment
Comments
0 comments on the analysis GOLD - USD - 1H