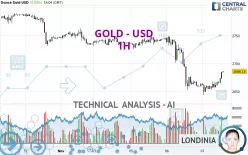
GOLD - USD - 1H - Technical analysis published on 11/07/2024 (GMT)
- 106
- 0
Click here for a new analysis!
- Timeframe : 1H
- - Analysis generated on
- Status : LEVEL MAINTAINED

Summary of the analysis

Additional analysis
Quotes
GOLD - USD rating 2,686.06 USD. The price registered an increase of +0.82% on the session with the lowest point at 2,643.45 USD and the highest point at 2,686.82 USD. The deviation from the price is +1.61% for the low point and -0.03% for the high point.A bearish opening was detected by the Central Gaps scanner. Sellers are trying to impose a bearish trend in the very short term.
Bearish opening
Type : Bearish
Timeframe : Openning
Here is a more detailed summary of the historical variations registered by GOLD - USD:
Near a new HIGH record (5 years)
Type : Bullish
Timeframe : Weekly
Near a new HIGH record (1 year)
Type : Bullish
Timeframe : Weekly
Near a new HIGH record (1st january)
Type : Bullish
Timeframe : Weekly
Near a new HIGH record (1 month)
Type : Bullish
Timeframe : Weekly
Technical
A technical analysis in 1H of this GOLD - USD chart shows a bearish trend. The signals given by moving averages are 71.43% bearish. This bearish trend could slow down given the neutral signals currently being given by short-term moving averages. The Central Indicators market scanner is currently detecting several bullish signals that could impact this trend:
Bullish trend reversal : adaptative moving average 20
Type : Bullish
Timeframe : 1 hour
Bullish price crossover with adaptative moving average 50
Type : Bullish
Timeframe : 1 hour
The technical indicators are bullish. There is still some doubt about the price increase.
Caution: the Central Indicators scanner currently detects an excess:
CCI indicator is overbought : over 100
Type : Neutral
Timeframe : 1 hour
Williams %R indicator is overbought : over -20
Type : Neutral
Timeframe : 1 hour
Pivot points : price is under support 3
Type : Neutral
Timeframe : Weekly
SuperTrend indicator bullish reversal
Type : Bullish
Timeframe : 1 hour
No signals are given by Central Patterns, a market scanner specialised in chart patterns, resistances and supports.
The Central Candlesticks scanner, specialised in Japanese candlesticks, did not identify any signals.
| S3 | S2 | S1 | Price | R1 | R2 | R3 | |
|---|---|---|---|---|---|---|---|
| ProTrendLines | 2,608.46 | 2,652.44 | 2,671.31 | 2,686.06 | 2,730.94 | 2,749.88 | 2,770.96 |
| Change (%) | -2.89% | -1.25% | -0.55% | - | +1.67% | +2.38% | +3.16% |
| Change | -77.60 | -33.62 | -14.75 | - | +44.88 | +63.82 | +84.90 |
| Level | Intermediate | Intermediate | Major | - | Intermediate | Intermediate | Minor |
Attention could also be paid to pivot points to set price objectives:
| Pivot points | S3 | S2 | S1 | PP | R1 | R2 | R3 |
|---|---|---|---|---|---|---|---|
| Standard | 2,530.51 | 2,591.48 | 2,627.80 | 2,688.77 | 2,725.09 | 2,786.06 | 2,822.38 |
| Camarilla | 2,637.38 | 2,646.29 | 2,655.21 | 2,664.13 | 2,673.05 | 2,681.97 | 2,690.89 |
| Woodie | 2,518.20 | 2,585.32 | 2,615.49 | 2,682.61 | 2,712.78 | 2,779.90 | 2,810.07 |
| Fibonacci | 2,591.48 | 2,628.64 | 2,651.60 | 2,688.77 | 2,725.93 | 2,748.89 | 2,786.06 |
| Pivot points | S3 | S2 | S1 | PP | R1 | R2 | R3 |
|---|---|---|---|---|---|---|---|
| Standard | 2,644.67 | 2,684.69 | 2,710.10 | 2,750.12 | 2,775.53 | 2,815.55 | 2,840.96 |
| Camarilla | 2,717.52 | 2,723.52 | 2,729.51 | 2,735.51 | 2,741.51 | 2,747.51 | 2,753.50 |
| Woodie | 2,637.37 | 2,681.04 | 2,702.80 | 2,746.47 | 2,768.23 | 2,811.90 | 2,833.66 |
| Fibonacci | 2,684.69 | 2,709.68 | 2,725.13 | 2,750.12 | 2,775.11 | 2,790.56 | 2,815.55 |
| Pivot points | S3 | S2 | S1 | PP | R1 | R2 | R3 |
|---|---|---|---|---|---|---|---|
| Standard | 2,449.76 | 2,526.52 | 2,636.63 | 2,713.39 | 2,823.50 | 2,900.26 | 3,010.37 |
| Camarilla | 2,695.36 | 2,712.49 | 2,729.62 | 2,746.75 | 2,763.88 | 2,781.01 | 2,798.14 |
| Woodie | 2,466.45 | 2,534.86 | 2,653.32 | 2,721.73 | 2,840.19 | 2,908.60 | 3,027.06 |
| Fibonacci | 2,526.52 | 2,597.90 | 2,642.00 | 2,713.39 | 2,784.77 | 2,828.87 | 2,900.26 |
Numerical data
The following is the status of the technical indicators and moving averages at the time of publication of this technical analysis:
| RSI (14): | 52.92 | |
| MACD (12,26,9): | -6.6500 | |
| Directional Movement: | -2.97 | |
| AROON (14): | 85.71 | |
| DEMA (21): | 2,657.53 | |
| Parabolic SAR (0,02-0,02-0,2): | 2,648.36 | |
| Elder Ray (13): | 9.06 | |
| Super Trend (3,10): | 2,682.90 | |
| Zig ZAG (10): | 2,677.30 | |
| VORTEX (21): | 1.0600 | |
| Stochastique (14,3,5): | 95.56 | |
| TEMA (21): | 2,663.59 | |
| Williams %R (14): | -5.82 | |
| Chande Momentum Oscillator (20): | 27.21 | |
| Repulse (5,40,3): | 0.4800 | |
| ROCnROLL: | -1 | |
| TRIX (15,9): | -0.0700 | |
| Courbe Coppock: | 0.44 |
| MA7: | 2,726.95 | |
| MA20: | 2,717.00 | |
| MA50: | 2,639.82 | |
| MA100: | 2,528.69 | |
| MAexp7: | 2,667.84 | |
| MAexp20: | 2,669.27 | |
| MAexp50: | 2,689.45 | |
| MAexp100: | 2,709.99 | |
| Price / MA7: | -1.50% | |
| Price / MA20: | -1.14% | |
| Price / MA50: | +1.75% | |
| Price / MA100: | +6.22% | |
| Price / MAexp7: | +0.68% | |
| Price / MAexp20: | +0.63% | |
| Price / MAexp50: | -0.12% | |
| Price / MAexp100: | -0.88% |
News
The latest news and videos published on GOLD - USD at the time of the analysis were as follows:
-
 XAU/USD Price Forecast Today, Technical Analysis (November 06): Gold Plunges After Election
-
#YourQuestionsAnswered | Why does gold keep going up this year?
-
XAU/USD Price Forecast Today, Technical Analysis (November 05): Gold Continues Its Small Pullback
-
Gold Rallies Slightly: XAU/USD Daily Forecast & Technical Analysis (11/05) #gold #xauusd #xau
-
XAU/USD Price Forecast Today, Technical Analysis (November 05): Gold Rallies Slightly
About author

Online


Add a comment
Comments
0 comments on the analysis GOLD - USD - 1H