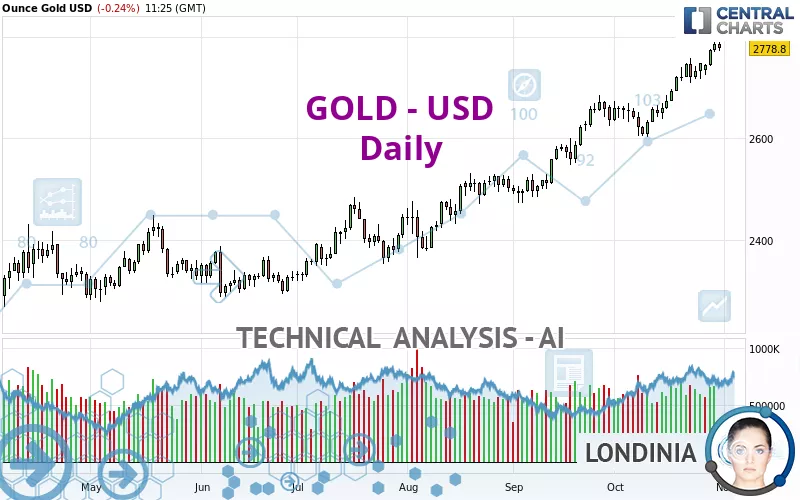
GOLD - USD - Daily - Technical analysis published on 10/31/2024 (GMT)
- 166
- 0
Click here for a new analysis!
- Timeframe : Daily
- - Analysis generated on
- Status : INVALID

Summary of the analysis

Additional analysis
Quotes
GOLD - USD rating 2,778.83 USD. The price registered a decrease of -0.24% on the session with the lowest point at 2,773.38 USD and the highest point at 2,790.14 USD. The deviation from the price is +0.20% for the low point and -0.41% for the high point.So that you have an overall view of the price change, here is a table showing the variations over several periods:
New HIGH record (5 years)
Type : Bullish
Timeframe : Weekly
New HIGH record (1 year)
Type : Bullish
Timeframe : Weekly
New HIGH record (1st january)
Type : Bullish
Timeframe : Weekly
New HIGH record (1 month)
Type : Bullish
Timeframe : Weekly
Technical
Technical analysis of this Daily chart of GOLD - USD indicates that the overall trend is strongly bullish. 92.86% of the signals given by moving averages are bullish. The overall trend is supported by the strong bullish signals from short-term moving averages. The Central Indicators market scanner currently does not detect any result that concerns moving averages.
An assessment of technical indicators shows a strong bullish signal.
Caution: the Central Indicators scanner currently detects an excess:
CCI indicator: bearish divergence
Type : Bearish
Timeframe : Daily
RSI indicator: bearish divergence
Type : Bearish
Timeframe : Daily
Pivot points : price is over resistance 1
Type : Neutral
Timeframe : Weekly
Price is back under the pivot point
Type : Bearish
Timeframe : Daily
No signals are given by Central Patterns, a market scanner specialised in chart patterns, resistances and supports.
No result was found by the Central Candlesticks scanner on Japanese candlesticks.
| S3 | S2 | S1 | Price | |
|---|---|---|---|---|
| ProTrendLines | 2,294.05 | 2,525.34 | 2,672.68 | 2,778.83 |
| Change (%) | -17.45% | -9.12% | -3.82% | - |
| Change | -484.78 | -253.49 | -106.15 | - |
| Level | Intermediate | Minor | Intermediate | - |
Pivot points can also be used to set your price objectives. Here is the price situation in relation to pivot points:
| Pivot points | S3 | S2 | S1 | PP | R1 | R2 | R3 |
|---|---|---|---|---|---|---|---|
| Standard | 2,755.18 | 2,763.07 | 2,774.25 | 2,782.14 | 2,793.32 | 2,801.21 | 2,812.39 |
| Camarilla | 2,780.19 | 2,781.93 | 2,783.68 | 2,785.43 | 2,787.18 | 2,788.93 | 2,790.67 |
| Woodie | 2,756.83 | 2,763.89 | 2,775.90 | 2,782.96 | 2,794.97 | 2,802.03 | 2,814.04 |
| Fibonacci | 2,763.07 | 2,770.36 | 2,774.86 | 2,782.14 | 2,789.43 | 2,793.93 | 2,801.21 |
| Pivot points | S3 | S2 | S1 | PP | R1 | R2 | R3 |
|---|---|---|---|---|---|---|---|
| Standard | 2,669.21 | 2,689.02 | 2,718.89 | 2,738.70 | 2,768.57 | 2,788.38 | 2,818.25 |
| Camarilla | 2,735.11 | 2,739.66 | 2,744.22 | 2,748.77 | 2,753.32 | 2,757.88 | 2,762.43 |
| Woodie | 2,674.25 | 2,691.54 | 2,723.93 | 2,741.22 | 2,773.61 | 2,790.90 | 2,823.29 |
| Fibonacci | 2,689.02 | 2,707.99 | 2,719.72 | 2,738.70 | 2,757.67 | 2,769.40 | 2,788.38 |
| Pivot points | S3 | S2 | S1 | PP | R1 | R2 | R3 |
|---|---|---|---|---|---|---|---|
| Standard | 2,296.16 | 2,384.02 | 2,509.87 | 2,597.73 | 2,723.58 | 2,811.44 | 2,937.29 |
| Camarilla | 2,576.94 | 2,596.53 | 2,616.12 | 2,635.71 | 2,655.30 | 2,674.89 | 2,694.48 |
| Woodie | 2,315.15 | 2,393.52 | 2,528.86 | 2,607.23 | 2,742.57 | 2,820.94 | 2,956.28 |
| Fibonacci | 2,384.02 | 2,465.66 | 2,516.10 | 2,597.73 | 2,679.37 | 2,729.81 | 2,811.44 |
Numerical data
The following is the status of technical indicators and moving averages registered at the time this technical analysis was created:
| RSI (14): | 73.43 | |
| MACD (12,26,9): | 45.3000 | |
| Directional Movement: | 22.97 | |
| AROON (14): | 100.00 | |
| DEMA (21): | 2,770.09 | |
| Parabolic SAR (0,02-0,02-0,2): | 2,724.62 | |
| Elder Ray (13): | 46.90 | |
| Super Trend (3,10): | 2,697.91 | |
| Zig ZAG (10): | 2,780.53 | |
| VORTEX (21): | 1.2100 | |
| Stochastique (14,3,5): | 96.58 | |
| TEMA (21): | 2,778.64 | |
| Williams %R (14): | -7.26 | |
| Chande Momentum Oscillator (20): | 118.44 | |
| Repulse (5,40,3): | 1.1900 | |
| ROCnROLL: | 1 | |
| TRIX (15,9): | 0.2200 | |
| Courbe Coppock: | 8.63 |
| MA7: | 2,755.54 | |
| MA20: | 2,698.80 | |
| MA50: | 2,620.93 | |
| MA100: | 2,510.14 | |
| MAexp7: | 2,758.41 | |
| MAexp20: | 2,711.26 | |
| MAexp50: | 2,632.20 | |
| MAexp100: | 2,536.70 | |
| Price / MA7: | +0.85% | |
| Price / MA20: | +2.97% | |
| Price / MA50: | +6.02% | |
| Price / MA100: | +10.70% | |
| Price / MAexp7: | +0.74% | |
| Price / MAexp20: | +2.49% | |
| Price / MAexp50: | +5.57% | |
| Price / MAexp100: | +9.55% |
News
The latest news and videos published on GOLD - USD at the time of the analysis were as follows:
-
 XAU/USD Price Forecast Today, Technical Analysis (October 30): Gold Continues Its Bullish Ascent
-
XAU/USD Price Forecast Today, Technical Analysis (October 30): Gold Continues to Look Bullish
-
Gold Breaks Out to New Record Highs: Forecast & Technical Analysis by Bruce Powers (October 29)
-
Gold Reaches for Higher Levels: XAU/USD Daily Forecast & Technical Analysis by Chris Lewis (10/29)
-
Gold Forecast October 29, 2024
About author

Online


Add a comment
Comments
0 comments on the analysis GOLD - USD - Daily