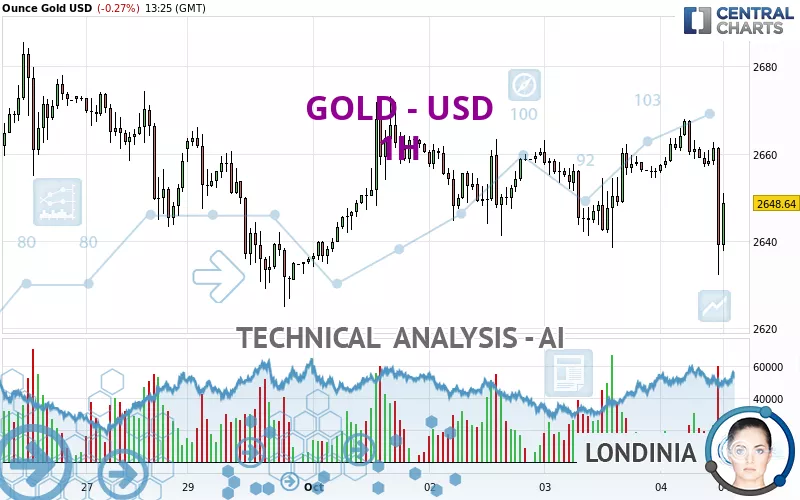
GOLD - USD - 1H - Technical analysis published on 10/04/2024 (GMT)
- 150
- 0
Click here for a new analysis!
- Timeframe : 1H
- - Analysis generated on
- Status : LEVEL MAINTAINED

Summary of the analysis

Additional analysis
Quotes
The GOLD - USD price is 2,648.61 USD. The price is lower by -0.27% since the last closing and was traded between 2,632.06 USD and 2,667.91 USD over the period. The price is currently at +0.63% from its lowest and -0.72% from its highest.The Central Gaps scanner detects a bullish opening. A small advantage for buyers in the very short term.
Bullish opening
Type : Bullish
Timeframe : Openning
Here is a more detailed summary of the historical variations registered by GOLD - USD:
Near a new HIGH record (5 years)
Type : Bullish
Timeframe : Weekly
Near a new HIGH record (1 year)
Type : Bullish
Timeframe : Weekly
Near a new HIGH record (1st january)
Type : Bullish
Timeframe : Weekly
Near a new HIGH record (1 month)
Type : Bullish
Timeframe : Weekly
Technical
Technical analysis of GOLD - USD in 1H shows an overall bearish trend. 71.43% of the signals given by moving averages are bearish. This bearish trend is supported by the strong bearish signals given by short-term moving averages. An assessment of moving averages reveals several bearish signals that could impact this trend:
Bearish trend reversal : Moving Average 20
Type : Bearish
Timeframe : 1 hour
Bearish trend reversal : Moving Average 50
Type : Bearish
Timeframe : 1 hour
Bearish trend reversal : Moving Average 100
Type : Bearish
Timeframe : 1 hour
Bearish trend reversal : adaptative moving average 20
Type : Bearish
Timeframe : 1 hour
Bearish trend reversal : adaptative moving average 50
Type : Bearish
Timeframe : 1 hour
Bearish trend reversal : adaptative moving average 100
Type : Bearish
Timeframe : 1 hour
In fact, 11 technical indicators on 18 studied are currently bearish. But beware of excesses. The Central Indicators scanner currently detects this:
CCI indicator is oversold : under -100
Type : Neutral
Timeframe : 1 hour
Previous candle closed under Bollinger bands
Type : Neutral
Timeframe : 1 hour
Price is back under the pivot point
Type : Bearish
Timeframe : Weekly
The analysis of the price chart with Central Patterns scanners does not return any result.
Central Candlesticks, the scanner specialised in Japanese candlesticks, detects a bullish signal that could support the hypothesis of a small rebound in the very short term:
Bullish harami
Type : Bullish
Timeframe : 1 hour
| S3 | S2 | S1 | Price | R1 | R2 | R3 | |
|---|---|---|---|---|---|---|---|
| ProTrendLines | 2,559.28 | 2,624.88 | 2,638.41 | 2,648.61 | 2,649.84 | 2,655.15 | 2,663.14 |
| Change (%) | -3.37% | -0.90% | -0.39% | - | +0.05% | +0.25% | +0.55% |
| Change | -89.33 | -23.73 | -10.20 | - | +1.23 | +6.54 | +14.53 |
| Level | Minor | Intermediate | Intermediate | - | Minor | Intermediate | Intermediate |
Pivot points can also be used to set your price objectives. Here is the price situation in relation to pivot points:
| Pivot points | S3 | S2 | S1 | PP | R1 | R2 | R3 |
|---|---|---|---|---|---|---|---|
| Standard | 2,617.23 | 2,627.82 | 2,641.83 | 2,652.42 | 2,666.43 | 2,677.02 | 2,691.03 |
| Camarilla | 2,649.08 | 2,651.33 | 2,653.59 | 2,655.84 | 2,658.10 | 2,660.35 | 2,662.61 |
| Woodie | 2,618.94 | 2,628.68 | 2,643.54 | 2,653.28 | 2,668.14 | 2,677.88 | 2,692.74 |
| Fibonacci | 2,627.82 | 2,637.22 | 2,643.02 | 2,652.42 | 2,661.82 | 2,667.62 | 2,677.02 |
| Pivot points | S3 | S2 | S1 | PP | R1 | R2 | R3 |
|---|---|---|---|---|---|---|---|
| Standard | 2,547.89 | 2,580.89 | 2,619.60 | 2,652.60 | 2,691.31 | 2,724.31 | 2,763.02 |
| Camarilla | 2,638.59 | 2,645.16 | 2,651.74 | 2,658.31 | 2,664.88 | 2,671.46 | 2,678.03 |
| Woodie | 2,550.75 | 2,582.32 | 2,622.46 | 2,654.03 | 2,694.17 | 2,725.74 | 2,765.88 |
| Fibonacci | 2,580.89 | 2,608.28 | 2,625.21 | 2,652.60 | 2,679.99 | 2,696.92 | 2,724.31 |
| Pivot points | S3 | S2 | S1 | PP | R1 | R2 | R3 |
|---|---|---|---|---|---|---|---|
| Standard | 2,296.16 | 2,384.02 | 2,509.87 | 2,597.73 | 2,723.58 | 2,811.44 | 2,937.29 |
| Camarilla | 2,576.94 | 2,596.53 | 2,616.12 | 2,635.71 | 2,655.30 | 2,674.89 | 2,694.48 |
| Woodie | 2,315.15 | 2,393.52 | 2,528.86 | 2,607.23 | 2,742.57 | 2,820.94 | 2,956.28 |
| Fibonacci | 2,384.02 | 2,465.66 | 2,516.10 | 2,597.73 | 2,679.37 | 2,729.81 | 2,811.44 |
Numerical data
The following are the details of the technical indicators and moving averages that were collected to generate this technical analysis:
| RSI (14): | 31.88 | |
| MACD (12,26,9): | -0.0700 | |
| Directional Movement: | -20.22 | |
| AROON (14): | -50.00 | |
| DEMA (21): | 2,657.21 | |
| Parabolic SAR (0,02-0,02-0,2): | 2,667.26 | |
| Elder Ray (13): | -7.03 | |
| Super Trend (3,10): | 2,668.77 | |
| Zig ZAG (10): | 2,638.65 | |
| VORTEX (21): | 0.9000 | |
| Stochastique (14,3,5): | 28.42 | |
| TEMA (21): | 2,656.08 | |
| Williams %R (14): | -99.22 | |
| Chande Momentum Oscillator (20): | -19.87 | |
| Repulse (5,40,3): | -1.1900 | |
| ROCnROLL: | 2 | |
| TRIX (15,9): | 0.0100 | |
| Courbe Coppock: | 0.05 |
| MA7: | 2,653.82 | |
| MA20: | 2,606.23 | |
| MA50: | 2,524.66 | |
| MA100: | 2,442.50 | |
| MAexp7: | 2,653.37 | |
| MAexp20: | 2,656.69 | |
| MAexp50: | 2,655.48 | |
| MAexp100: | 2,653.74 | |
| Price / MA7: | -0.20% | |
| Price / MA20: | +1.63% | |
| Price / MA50: | +4.91% | |
| Price / MA100: | +8.44% | |
| Price / MAexp7: | -0.18% | |
| Price / MAexp20: | -0.30% | |
| Price / MAexp50: | -0.26% | |
| Price / MAexp100: | -0.19% |
News
The latest news and videos published on GOLD - USD at the time of the analysis were as follows:
-
 Gold Forecast October 4, 2024
-
Gold Markets Continues to Consolidate: Forecast & Technical Analysis by Chris Lewis (October 03)
-
Technical Analysis on Gold, GBPUSD, EURGBP
-
Gold Continues to Consolidate at Highs: Forecast & Technical Analysis by Chris Lewis (October 02)
-
Gold Forecast October 2, 2024
About author

Online


Add a comment
Comments
0 comments on the analysis GOLD - USD - 1H