GOLD - USD - Daily - Technical analysis published on 09/12/2024 (GMT)
- 135
- 0
Click here for a new analysis!
- Timeframe : Daily
- - Analysis generated on
- Status : TARGET REACHED

Summary of the analysis

Additional analysis
Quotes
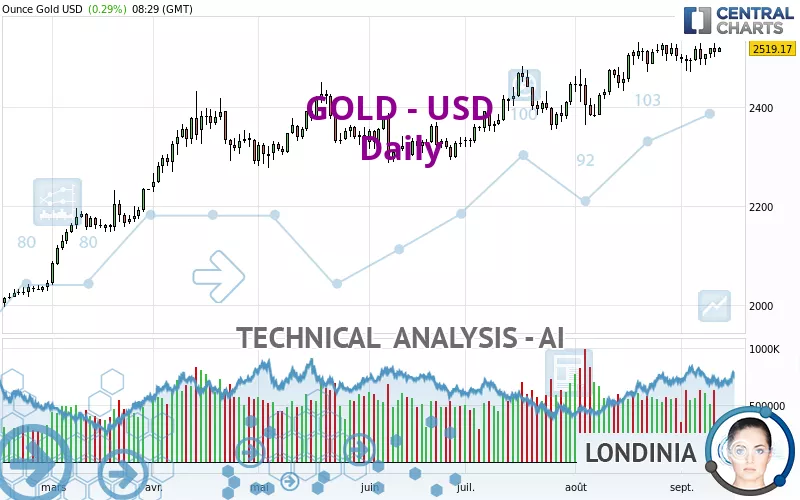
The GOLD - USD price is 2,519.23 USD. The price registered an increase of +0.29% on the session and was between 2,511.05 USD and 2,522.33 USD. This implies that the price is at +0.33% from its lowest and at -0.12% from its highest.The Central Gaps scanner detects a bullish opening. A small advantage for buyers in the very short term.
Bullish opening
Type : Bullish
Timeframe : Openning
Here is a more detailed summary of the historical variations registered by GOLD - USD:
Near a new HIGH record (5 years)
Type : Bullish
Timeframe : Weekly
Near a new HIGH record (1 year)
Type : Bullish
Timeframe : Weekly
Near a new HIGH record (1st january)
Type : Bullish
Timeframe : Weekly
Near a new LOW record (1 month)
Type : Bearish
Timeframe : Weekly
Technical
A technical analysis in Daily of this GOLD - USD chart shows a strongly bullish trend. 92.86% of the signals given by moving averages are bullish. The overall trend is supported by the strong bullish signals from short-term moving averages. There is no crossing of moving average by the price or crossing of moving averages between themselves.
Technical indicators are slightly bullish. There is therefore considerable uncertainty about the continuation of the increase.
But beware of excesses. The Central Indicators scanner currently detects this:
Williams %R indicator is overbought : over -20
Type : Neutral
Timeframe : Daily
Price is back over the pivot point
Type : Bullish
Timeframe : Daily
Price is back over the pivot point
Type : Bullish
Timeframe : Weekly
The analysis of the price chart with Central Patterns scanners does not return any result.
The Central Candlesticks scanner which studies Japanese candlesticks did not detect anything.
| S3 | S2 | S1 | Price | R1 | |
|---|---|---|---|---|---|
| ProTrendLines | 2,049.28 | 2,294.05 | 2,362.61 | 2,519.23 | 2,525.34 |
| Change (%) | -18.65% | -8.94% | -6.22% | - | +0.24% |
| Change | -469.95 | -225.18 | -156.62 | - | +6.11 |
| Level | Major | Intermediate | Intermediate | - | Major |
Attention could also be paid to pivot points to set price objectives:
| Pivot points | S3 | S2 | S1 | PP | R1 | R2 | R3 |
|---|---|---|---|---|---|---|---|
| Standard | 2,470.97 | 2,486.00 | 2,499.00 | 2,514.03 | 2,527.03 | 2,542.06 | 2,555.06 |
| Camarilla | 2,504.28 | 2,506.85 | 2,509.42 | 2,511.99 | 2,514.56 | 2,517.13 | 2,519.70 |
| Woodie | 2,469.95 | 2,485.49 | 2,497.98 | 2,513.52 | 2,526.01 | 2,541.55 | 2,554.04 |
| Fibonacci | 2,486.00 | 2,496.71 | 2,503.33 | 2,514.03 | 2,524.74 | 2,531.36 | 2,542.06 |
| Pivot points | S3 | S2 | S1 | PP | R1 | R2 | R3 |
|---|---|---|---|---|---|---|---|
| Standard | 2,412.37 | 2,442.13 | 2,469.76 | 2,499.52 | 2,527.15 | 2,556.91 | 2,584.54 |
| Camarilla | 2,481.61 | 2,486.87 | 2,492.13 | 2,497.39 | 2,502.65 | 2,507.91 | 2,513.17 |
| Woodie | 2,411.31 | 2,441.60 | 2,468.70 | 2,498.99 | 2,526.09 | 2,556.38 | 2,583.48 |
| Fibonacci | 2,442.13 | 2,464.05 | 2,477.60 | 2,499.52 | 2,521.44 | 2,534.99 | 2,556.91 |
| Pivot points | S3 | S2 | S1 | PP | R1 | R2 | R3 |
|---|---|---|---|---|---|---|---|
| Standard | 2,233.73 | 2,299.04 | 2,401.13 | 2,466.44 | 2,568.53 | 2,633.84 | 2,735.93 |
| Camarilla | 2,457.20 | 2,472.54 | 2,487.89 | 2,503.23 | 2,518.58 | 2,533.92 | 2,549.27 |
| Woodie | 2,252.13 | 2,308.24 | 2,419.53 | 2,475.64 | 2,586.93 | 2,643.04 | 2,754.33 |
| Fibonacci | 2,299.04 | 2,362.98 | 2,402.49 | 2,466.44 | 2,530.38 | 2,569.89 | 2,633.84 |
Numerical data
The following are the details of the technical indicators and moving averages that were collected to generate this technical analysis:
| RSI (14): | 58.46 | |
| MACD (12,26,9): | 17.9400 | |
| Directional Movement: | 5.50 | |
| AROON (14): | 14.29 | |
| DEMA (21): | 2,523.57 | |
| Parabolic SAR (0,02-0,02-0,2): | 2,476.35 | |
| Elder Ray (13): | 10.85 | |
| Super Trend (3,10): | 2,431.85 | |
| Zig ZAG (10): | 2,517.09 | |
| VORTEX (21): | 1.1200 | |
| Stochastique (14,3,5): | 76.77 | |
| TEMA (21): | 2,519.56 | |
| Williams %R (14): | -21.68 | |
| Chande Momentum Oscillator (20): | -8.30 | |
| Repulse (5,40,3): | 0.4700 | |
| ROCnROLL: | 1 | |
| TRIX (15,9): | 0.1300 | |
| Courbe Coppock: | 0.48 |
| MA7: | 2,509.38 | |
| MA20: | 2,508.03 | |
| MA50: | 2,452.61 | |
| MA100: | 2,396.09 | |
| MAexp7: | 2,510.94 | |
| MAexp20: | 2,497.24 | |
| MAexp50: | 2,455.70 | |
| MAexp100: | 2,392.08 | |
| Price / MA7: | +0.39% | |
| Price / MA20: | +0.45% | |
| Price / MA50: | +2.72% | |
| Price / MA100: | +5.14% | |
| Price / MAexp7: | +0.33% | |
| Price / MAexp20: | +0.88% | |
| Price / MAexp50: | +2.59% | |
| Price / MAexp100: | +5.32% |
News
Don't forget to follow the news on GOLD - USD. At the time of publication of this analysis, the latest news was as follows:
-
 Gold Attempts to Break Out: Forecast & Technical Analysis by Bruce Powers (September 11)
-
Gold Gives Up Early Gains After CPI: Forecast & Technical Analysis by Chris Lewis (September 11)
-
Gold Consolidates on Tuesday: Forecast & Technical Analysis by Bruce Powers (September 10)
-
Gold Forecast September 10, 2024
-
Gold, Continues to See Buyers: XAU/USD Technical Analysis by Chris Lewis for FX Empire (09/09)
About author

Online


Add a comment
Comments
0 comments on the analysis GOLD - USD - Daily