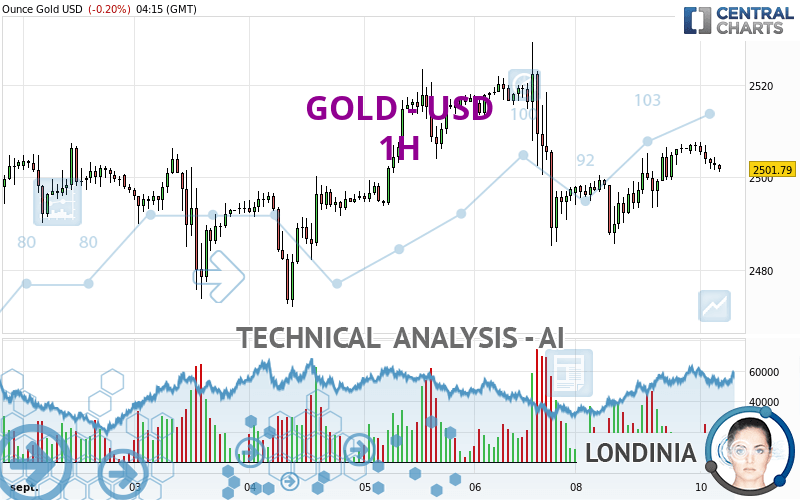
GOLD - USD - 1H - Technical analysis published on 09/10/2024 (GMT)
- 115
- 0
Click here for a new analysis!
- Timeframe : 1H
- - Analysis generated on
- Status : INVALID
Summary of the analysis

Additional analysis
Quotes
The GOLD - USD price is 2,501.79 USD. The price registered a decrease of -0.20% on the session and was between 2,501.22 USD and 2,507.57 USD. This implies that the price is at +0.02% from its lowest and at -0.23% from its highest.The Central Gaps scanner detects a bullish opening. A small advantage for buyers in the very short term.
Bullish opening
Type : Bullish
Timeframe : Openning
Here is a more detailed summary of the historical variations registered by GOLD - USD:
Near a new HIGH record (5 years)
Type : Bullish
Timeframe : Weekly
Near a new HIGH record (1 year)
Type : Bullish
Timeframe : Weekly
Near a new HIGH record (1st january)
Type : Bullish
Timeframe : Weekly
Near a new LOW record (1 month)
Type : Bearish
Timeframe : Weekly
Technical
A technical analysis in 1H of this GOLD - USD chart shows a bearish trend. 67.86% of the signals given by moving averages are bearish. The overall trend seems to be showing some signs of weakness, as do the tentative bearish signals from short-term moving averages. An assessment of moving averages reveals several bearish signals that could impact this trend:
Bearish trend reversal : adaptative moving average 20
Type : Bearish
Timeframe : 1 hour
Bearish trend reversal : adaptative moving average 50
Type : Bearish
Timeframe : 1 hour
Bearish trend reversal : adaptative moving average 100
Type : Bearish
Timeframe : 1 hour
Bearish price crossover with Moving Average 20
Type : Bearish
Timeframe : 1 hour
Bearish price crossover with Moving Average 100
Type : Bearish
Timeframe : 1 hour
On the 18 technical indicators analysed, 4 are bullish, 7 are neutral and 7 are bearish. Central Indicators, the scanner specialised in technical indicators, has identified these signals:
RSI indicator is back under 50
Type : Bearish
Timeframe : 1 hour
Price is back over the pivot point
Type : Bullish
Timeframe : Weekly
Momentum indicator is back under 0
Type : Bearish
Timeframe : 1 hour
No signals are given by Central Patterns, a market scanner specialised in chart patterns, resistances and supports.
No result was found by the Central Candlesticks scanner on Japanese candlesticks.
| S3 | S2 | S1 | Price | R1 | R2 | R3 | |
|---|---|---|---|---|---|---|---|
| ProTrendLines | 2,485.39 | 2,489.99 | 2,500.40 | 2,501.79 | 2,507.36 | 2,512.22 | 2,525.34 |
| Change (%) | -0.66% | -0.47% | -0.06% | - | +0.22% | +0.42% | +0.94% |
| Change | -16.40 | -11.80 | -1.39 | - | +5.57 | +10.43 | +23.55 |
| Level | Major | Minor | Minor | - | Minor | Minor | Major |
Pivot points can also be used to set your price objectives. Here is the price situation in relation to pivot points:
| Pivot points | S3 | S2 | S1 | PP | R1 | R2 | R3 |
|---|---|---|---|---|---|---|---|
| Standard | 2,470.25 | 2,477.92 | 2,492.37 | 2,500.04 | 2,514.49 | 2,522.16 | 2,536.61 |
| Camarilla | 2,500.73 | 2,502.76 | 2,504.78 | 2,506.81 | 2,508.84 | 2,510.87 | 2,512.89 |
| Woodie | 2,473.63 | 2,479.62 | 2,495.75 | 2,501.74 | 2,517.87 | 2,523.86 | 2,539.99 |
| Fibonacci | 2,477.92 | 2,486.37 | 2,491.59 | 2,500.04 | 2,508.49 | 2,513.71 | 2,522.16 |
| Pivot points | S3 | S2 | S1 | PP | R1 | R2 | R3 |
|---|---|---|---|---|---|---|---|
| Standard | 2,412.37 | 2,442.13 | 2,469.76 | 2,499.52 | 2,527.15 | 2,556.91 | 2,584.54 |
| Camarilla | 2,481.61 | 2,486.87 | 2,492.13 | 2,497.39 | 2,502.65 | 2,507.91 | 2,513.17 |
| Woodie | 2,411.31 | 2,441.60 | 2,468.70 | 2,498.99 | 2,526.09 | 2,556.38 | 2,583.48 |
| Fibonacci | 2,442.13 | 2,464.05 | 2,477.60 | 2,499.52 | 2,521.44 | 2,534.99 | 2,556.91 |
| Pivot points | S3 | S2 | S1 | PP | R1 | R2 | R3 |
|---|---|---|---|---|---|---|---|
| Standard | 2,233.73 | 2,299.04 | 2,401.13 | 2,466.44 | 2,568.53 | 2,633.84 | 2,735.93 |
| Camarilla | 2,457.20 | 2,472.54 | 2,487.89 | 2,503.23 | 2,518.58 | 2,533.92 | 2,549.27 |
| Woodie | 2,252.13 | 2,308.24 | 2,419.53 | 2,475.64 | 2,586.93 | 2,643.04 | 2,754.33 |
| Fibonacci | 2,299.04 | 2,362.98 | 2,402.49 | 2,466.44 | 2,530.38 | 2,569.89 | 2,633.84 |
Numerical data
The following is the status of the technical indicators and moving averages at the time of publication of this technical analysis:
| RSI (14): | 49.32 | |
| MACD (12,26,9): | 0.8400 | |
| Directional Movement: | -1.75 | |
| AROON (14): | 64.29 | |
| DEMA (21): | 2,503.51 | |
| Parabolic SAR (0,02-0,02-0,2): | 2,507.04 | |
| Elder Ray (13): | -0.82 | |
| Super Trend (3,10): | 2,508.65 | |
| Zig ZAG (10): | 2,501.91 | |
| VORTEX (21): | 1.1400 | |
| Stochastique (14,3,5): | 62.70 | |
| TEMA (21): | 2,505.04 | |
| Williams %R (14): | -42.87 | |
| Chande Momentum Oscillator (20): | -2.70 | |
| Repulse (5,40,3): | -0.1200 | |
| ROCnROLL: | 2 | |
| TRIX (15,9): | 0.0000 | |
| Courbe Coppock: | 0.47 |
| MA7: | 2,501.37 | |
| MA20: | 2,501.15 | |
| MA50: | 2,446.03 | |
| MA100: | 2,392.11 | |
| MAexp7: | 2,503.41 | |
| MAexp20: | 2,502.72 | |
| MAexp50: | 2,502.70 | |
| MAexp100: | 2,502.93 | |
| Price / MA7: | +0.02% | |
| Price / MA20: | +0.03% | |
| Price / MA50: | +2.28% | |
| Price / MA100: | +4.59% | |
| Price / MAexp7: | -0.06% | |
| Price / MAexp20: | -0.04% | |
| Price / MAexp50: | -0.04% | |
| Price / MAexp100: | -0.05% |
News
The last news published on GOLD - USD at the time of the generation of this analysis was as follows:
-
 Gold Forecast September 10, 2024
-
Gold, Continues to See Buyers: XAU/USD Technical Analysis by Chris Lewis for FX Empire (09/09)
-
Gold Continues to See Buyers: XAU/USD Forecast & Technical Analysis by Chris Lewis (September 9)
-
Paris 2024 Paralympics draws to a close with ParalympicsGB winning 49 gold medals
-
Gold Star father Khizr Khan endorses Kamala Harris for president
About author

Online


Add a comment
Comments
0 comments on the analysis GOLD - USD - 1H