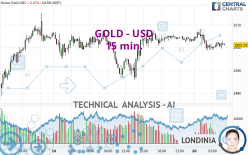
GOLD - USD - 15 min. - Technical analysis published on 08/20/2024 (GMT)
- 84
- 0
Click here for a new analysis!
- Timeframe : 15 min.
- - Analysis generated on
- Status : INVALID

Summary of the analysis

Additional analysis
Quotes
GOLD - USD rating 2,501.14 USD. On the day, this instrument lost -0.10% and was between 2,498.71 USD and 2,508.28 USD. This implies that the price is at +0.10% from its lowest and at -0.28% from its highest.A study of price movements over other periods shows the following variations:
New HIGH record (5 years)
Type : Bullish
Timeframe : Weekly
Near a new HIGH record (1 year)
Type : Bullish
Timeframe : Weekly
Near a new HIGH record (1st january)
Type : Bullish
Timeframe : Weekly
Near a new HIGH record (1 month)
Type : Bullish
Timeframe : Weekly
Technical
Technical analysis of this 15 min. chart of GOLD - USD indicates that the overall trend is bearish. 64.29% of the signals given by moving averages are bearish. This bearish trend is supported by the strong bearish signals given by short-term moving averages. The Central Indicators market scanner is currently detecting several bearish and bullish signals that could impact this trend:
Bearish trend reversal : Moving Average 100
Type : Bearish
Timeframe : 15 minutes
Bullish price crossover with Moving Average 20
Type : Bullish
Timeframe : 15 minutes
Bullish price crossover with Moving Average 100
Type : Bullish
Timeframe : 15 minutes
Bullish price crossover with adaptative moving average 20
Type : Bullish
Timeframe : 15 minutes
Bullish price crossover with adaptative moving average 50
Type : Bullish
Timeframe : 15 minutes
Bullish price crossover with adaptative moving average 100
Type : Bullish
Timeframe : 15 minutes
In fact, Central Analyzer took into account 18 technical indicators and the result was as follows: 6 are bullish, 9 are neutral and 3 are bearish. Caution: the Central Indicators scanner currently detects an excess:
MACD indicator: bullish divergence
Type : Bullish
Timeframe : 15 minutes
RSI indicator is back over 50
Type : Bullish
Timeframe : 15 minutes
Williams %R indicator is back over -50
Type : Bullish
Timeframe : 15 minutes
The analysis of the price chart with Central Patterns scanners does not return any result.
The Central Candlesticks scanner which studies Japanese candlesticks did not detect anything.
| S3 | S2 | S1 | Price | R1 | |
|---|---|---|---|---|---|
| ProTrendLines | 2,432.34 | 2,458.87 | 2,475.54 | 2,501.14 | 2,515.20 |
| Change (%) | -2.75% | -1.69% | -1.02% | - | +0.56% |
| Change | -68.80 | -42.27 | -25.60 | - | +14.06 |
| Level | Intermediate | Minor | Intermediate | - | Intermediate |
To determine price objectives, it is also possible to use the pivot points. Here is the price position in relation to pivot points:
| Pivot points | S3 | S2 | S1 | PP | R1 | R2 | R3 |
|---|---|---|---|---|---|---|---|
| Standard | 2,458.37 | 2,472.05 | 2,487.85 | 2,501.53 | 2,517.33 | 2,531.01 | 2,546.81 |
| Camarilla | 2,495.55 | 2,498.26 | 2,500.96 | 2,503.66 | 2,506.36 | 2,509.07 | 2,511.77 |
| Woodie | 2,459.44 | 2,472.58 | 2,488.92 | 2,502.06 | 2,518.40 | 2,531.54 | 2,547.88 |
| Fibonacci | 2,472.05 | 2,483.31 | 2,490.27 | 2,501.53 | 2,512.79 | 2,519.75 | 2,531.01 |
| Pivot points | S3 | S2 | S1 | PP | R1 | R2 | R3 |
|---|---|---|---|---|---|---|---|
| Standard | 2,363.64 | 2,393.73 | 2,449.58 | 2,479.67 | 2,535.52 | 2,565.61 | 2,621.46 |
| Camarilla | 2,481.79 | 2,489.66 | 2,497.54 | 2,505.42 | 2,513.30 | 2,521.18 | 2,529.05 |
| Woodie | 2,376.51 | 2,400.17 | 2,462.45 | 2,486.11 | 2,548.39 | 2,572.05 | 2,634.33 |
| Fibonacci | 2,393.73 | 2,426.56 | 2,446.84 | 2,479.67 | 2,512.50 | 2,532.78 | 2,565.61 |
| Pivot points | S3 | S2 | S1 | PP | R1 | R2 | R3 |
|---|---|---|---|---|---|---|---|
| Standard | 2,183.11 | 2,250.83 | 2,348.31 | 2,416.03 | 2,513.51 | 2,581.23 | 2,678.71 |
| Camarilla | 2,400.37 | 2,415.51 | 2,430.66 | 2,445.80 | 2,460.94 | 2,476.09 | 2,491.23 |
| Woodie | 2,198.00 | 2,258.27 | 2,363.20 | 2,423.47 | 2,528.40 | 2,588.67 | 2,693.60 |
| Fibonacci | 2,250.83 | 2,313.93 | 2,352.92 | 2,416.03 | 2,479.13 | 2,518.12 | 2,581.23 |
Numerical data
The following is the status of technical indicators and moving averages registered at the time this technical analysis was created:
| RSI (14): | 47.64 | |
| MACD (12,26,9): | -0.6700 | |
| Directional Movement: | -12.25 | |
| AROON (14): | -28.57 | |
| DEMA (21): | 2,500.95 | |
| Parabolic SAR (0,02-0,02-0,2): | 2,503.65 | |
| Elder Ray (13): | -0.62 | |
| Super Trend (3,10): | 2,507.07 | |
| Zig ZAG (10): | 2,501.65 | |
| VORTEX (21): | 0.9500 | |
| Stochastique (14,3,5): | 27.63 | |
| TEMA (21): | 2,500.33 | |
| Williams %R (14): | -57.45 | |
| Chande Momentum Oscillator (20): | -3.19 | |
| Repulse (5,40,3): | 0.0700 | |
| ROCnROLL: | -1 | |
| TRIX (15,9): | 0.0000 | |
| Courbe Coppock: | 0.25 |
| MA7: | 2,479.57 | |
| MA20: | 2,433.05 | |
| MA50: | 2,391.57 | |
| MA100: | 2,368.27 | |
| MAexp7: | 2,501.35 | |
| MAexp20: | 2,501.74 | |
| MAexp50: | 2,501.95 | |
| MAexp100: | 2,499.52 | |
| Price / MA7: | +0.87% | |
| Price / MA20: | +2.80% | |
| Price / MA50: | +4.58% | |
| Price / MA100: | +5.61% | |
| Price / MAexp7: | -0.01% | |
| Price / MAexp20: | -0.02% | |
| Price / MAexp50: | -0.03% | |
| Price / MAexp100: | +0.06% |
News
The latest news and videos published on GOLD - USD at the time of the analysis were as follows:
-
 Gold Continues to See Support After a Dip: Forecast & Technical Analysis by Chris Lewis (August 19)
-
Gold medal boxer Imane Khelif gets hero’s welcome in Algeria | DW News
-
Keely Hodgkinson aims to defend gold medal at LA 2028 Olympics
-
Gold Breaks Out to a New Record High: Forecast & Technical Analysis by Bruce Powers (August 16)
-
Can Taylor Swift really bring a £1bn economic gold rush?
About author

Online


Add a comment
Comments
0 comments on the analysis GOLD - USD - 15 min.