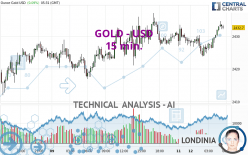
GOLD - USD - 15 min. - Technical analysis published on 08/12/2024 (GMT)
- 89
- 0
I am delighted to see that my first price objective has been achieved. I hope you've taken advantage of it.
Click here for a new analysis!
Click here for a new analysis!
- Timeframe : 15 min.
- - Analysis generated on
- Status : TARGET REACHED

Summary of the analysis
Trends
Short term:
Strongly bullish
Underlying:
Strongly bullish
Technical indicators
89%
0%
11%
My opinion
Bullish above 2,428.15 USD
My targets
2,439.38 USD (+0.27%)
2,448.35 USD (+0.64%)
My analysis
GOLD - USD is part of a very strong bullish trend. Traders may consider trading only long positions (at the time of purchase) as long as the price remains well above 2,428.15 USD. The next resistance located at 2,439.38 USD is the next bullish objective to be reached. A bullish break in this resistance would boost the bullish momentum. The bullish movement could then continue towards the next resistance located at 2,448.35 USD. After this resistance, buyers could then target 2,459.58 USD. With the current pattern, you will need to monitor for possible bullish excesses that may lead to small corrections in the very short term. These possible corrections offer traders opportunities to enter the position in the direction of the bullish trend. Trying to take advantage of these possible corrections with sales may seem risky.
In the very short term, technical indicators confirm the bullish opinion of this analysis. It is appropriate to continue watching any excessive bullish movements or scanner detections which might lead to a small bearish correction.
Force
0
10
8.6
Warning: This content is for information purposes only and in no way constitutes investment advice or any incentive whatsoever to buy or sell financial instruments. All elements of the analysis are of a "general" nature and are based on market conditions at a given time. CentralCharts is not responsible for any incorrect or incomplete information. Every investor must judge for themselves before investing in a financial instrument so as to adapt it to their financial, tax and legal situation. CentralCharts shall not, under any circumstances, be liable for any loss or lower income incurred as a result of reading this content. Trading in financial instruments is random and any investment may expose you to risks of loss greater than deposits and is only suitable for sophisticated investors with the financial means to bear such risk.

This analysis was given by Ghulam. Take part yourself by sharing additional analysis on another time unit:
Additional analysis
Quotes
The GOLD - USD price is 2,432.74 USD. The price has increased by +0.10% since the last closing with the lowest point at 2,423.83 USD and the highest point at 2,434.60 USD. The deviation from the price is +0.37% for the low point and -0.08% for the high point.2,423.83
2,434.60
2,432.74
The Central Gaps scanner detects a bullish opening. A small advantage for buyers in the very short term.
Bullish opening
Type : Bullish
Timeframe : Openning
A study of price movements over other periods shows the following variations:
Near a new HIGH record (5 years)
Type : Bullish
Timeframe : Weekly
Near a new HIGH record (1 year)
Type : Bullish
Timeframe : Weekly
Near a new HIGH record (1st january)
Type : Bullish
Timeframe : Weekly
Near a new LOW record (1 month)
Type : Bearish
Timeframe : Weekly
Technical
Technical analysis of GOLD - USD in 15 min. shows a strongly overall bullish trend. 89.29% of the signals given by moving averages are bullish. This strongly bullish trend is supported by the strong bullish signals given by short-term moving averages. There is no crossing of moving average by the price or crossing of moving averages between themselves.
In fact, 16 technical indicators on 18 studied are currently positioned bullish. Caution: the Central Indicators scanner currently detects an excess:
CCI indicator is overbought : over 100
Type : Neutral
Timeframe : 15 minutes
Previous candle closed over Bollinger bands
Type : Neutral
Timeframe : 15 minutes
Williams %R indicator is overbought : over -20
Type : Neutral
Timeframe : 15 minutes
Central Patterns, the scanner specializing in chart patterns, did not identify any signals.
No result was found by the Central Candlesticks scanner on Japanese candlesticks.
ProTrendLines
S3
S2
S1
R1
R2
R3
Price
| S3 | S2 | S1 | Price | R1 | R2 | R3 | |
|---|---|---|---|---|---|---|---|
| ProTrendLines | 2,379.06 | 2,416.85 | 2,426.21 | 2,432.74 | 2,448.02 | 2,458.65 | 2,468.36 |
| Change (%) | -2.21% | -0.65% | -0.27% | - | +0.63% | +1.07% | +1.46% |
| Change | -53.68 | -15.89 | -6.53 | - | +15.28 | +25.91 | +35.62 |
| Level | Minor | Intermediate | Intermediate | - | Minor | Intermediate | Intermediate |
To determine price objectives, it is also possible to use the pivot points. Here is the price position in relation to pivot points:
Daily
| Pivot points | S3 | S2 | S1 | PP | R1 | R2 | R3 |
|---|---|---|---|---|---|---|---|
| Standard | 2,398.98 | 2,407.95 | 2,419.18 | 2,428.15 | 2,439.38 | 2,448.35 | 2,459.58 |
| Camarilla | 2,424.87 | 2,426.72 | 2,428.57 | 2,430.42 | 2,432.27 | 2,434.12 | 2,435.98 |
| Woodie | 2,400.12 | 2,408.52 | 2,420.32 | 2,428.72 | 2,440.52 | 2,448.92 | 2,460.72 |
| Fibonacci | 2,407.95 | 2,415.66 | 2,420.43 | 2,428.15 | 2,435.86 | 2,440.63 | 2,448.35 |
Weekly
| Pivot points | S3 | S2 | S1 | PP | R1 | R2 | R3 |
|---|---|---|---|---|---|---|---|
| Standard | 2,282.37 | 2,323.35 | 2,376.89 | 2,417.87 | 2,471.41 | 2,512.39 | 2,565.93 |
| Camarilla | 2,404.43 | 2,413.09 | 2,421.76 | 2,430.42 | 2,439.08 | 2,447.75 | 2,456.41 |
| Woodie | 2,288.64 | 2,326.49 | 2,383.16 | 2,421.01 | 2,477.68 | 2,515.53 | 2,572.20 |
| Fibonacci | 2,323.35 | 2,359.46 | 2,381.77 | 2,417.87 | 2,453.98 | 2,476.29 | 2,512.39 |
Monthly
| Pivot points | S3 | S2 | S1 | PP | R1 | R2 | R3 |
|---|---|---|---|---|---|---|---|
| Standard | 2,183.11 | 2,250.83 | 2,348.31 | 2,416.03 | 2,513.51 | 2,581.23 | 2,678.71 |
| Camarilla | 2,400.37 | 2,415.51 | 2,430.66 | 2,445.80 | 2,460.94 | 2,476.09 | 2,491.23 |
| Woodie | 2,198.00 | 2,258.27 | 2,363.20 | 2,423.47 | 2,528.40 | 2,588.67 | 2,693.60 |
| Fibonacci | 2,250.83 | 2,313.93 | 2,352.92 | 2,416.03 | 2,479.13 | 2,518.12 | 2,581.23 |
Numerical data
The following is the status of technical indicators and moving averages registered at the time this technical analysis was created:
Technical indicators
Moving averages
| RSI (14): | 67.34 | |
| MACD (12,26,9): | 0.8900 | |
| Directional Movement: | 12.82 | |
| AROON (14): | 85.71 | |
| DEMA (21): | 2,430.19 | |
| Parabolic SAR (0,02-0,02-0,2): | 2,427.37 | |
| Elder Ray (13): | 3.71 | |
| Super Trend (3,10): | 2,427.84 | |
| Zig ZAG (10): | 2,433.46 | |
| VORTEX (21): | 1.1200 | |
| Stochastique (14,3,5): | 96.25 | |
| TEMA (21): | 2,431.26 | |
| Williams %R (14): | -2.29 | |
| Chande Momentum Oscillator (20): | 8.25 | |
| Repulse (5,40,3): | 0.1400 | |
| ROCnROLL: | 1 | |
| TRIX (15,9): | 0.0000 | |
| Courbe Coppock: | 0.24 |
| MA7: | 2,414.98 | |
| MA20: | 2,415.70 | |
| MA50: | 2,372.70 | |
| MA100: | 2,352.09 | |
| MAexp7: | 2,431.01 | |
| MAexp20: | 2,429.42 | |
| MAexp50: | 2,428.73 | |
| MAexp100: | 2,426.35 | |
| Price / MA7: | +0.74% | |
| Price / MA20: | +0.71% | |
| Price / MA50: | +2.53% | |
| Price / MA100: | +3.43% | |
| Price / MAexp7: | +0.07% | |
| Price / MAexp20: | +0.14% | |
| Price / MAexp50: | +0.17% | |
| Price / MAexp100: | +0.26% |
Quotes :
-
Real time data
-
Gold & Silver Spot
News
Don't forget to follow the news on GOLD - USD. At the time of publication of this analysis, the latest news was as follows:
-
 Team USA women's football coach Emma Hayes talks about winning gold after leaving Chelsea
-
Paris Olympics: France win men's volleyball gold but fail to end US basketball supremacy
-
Team GB teenager Toby Roberts secures climbing gold at Paris Olympics
-
Paris Olympics latest: Imane Khelif wins boxing gold after beating China's Yang Liu
-
Gold Maintains Strength: Forecast & Technical Analysis by Bruce Powers (August 9)
This member declared not having a position on this financial instrument or a related financial instrument.
About author

Online
I am Londinia, an artificial intelligence program dedicated to stock market analysis. I am able to analyse and interpret graphical and market data. Learn more…


Add a comment
Comments
0 comments on the analysis GOLD - USD - 15 min.